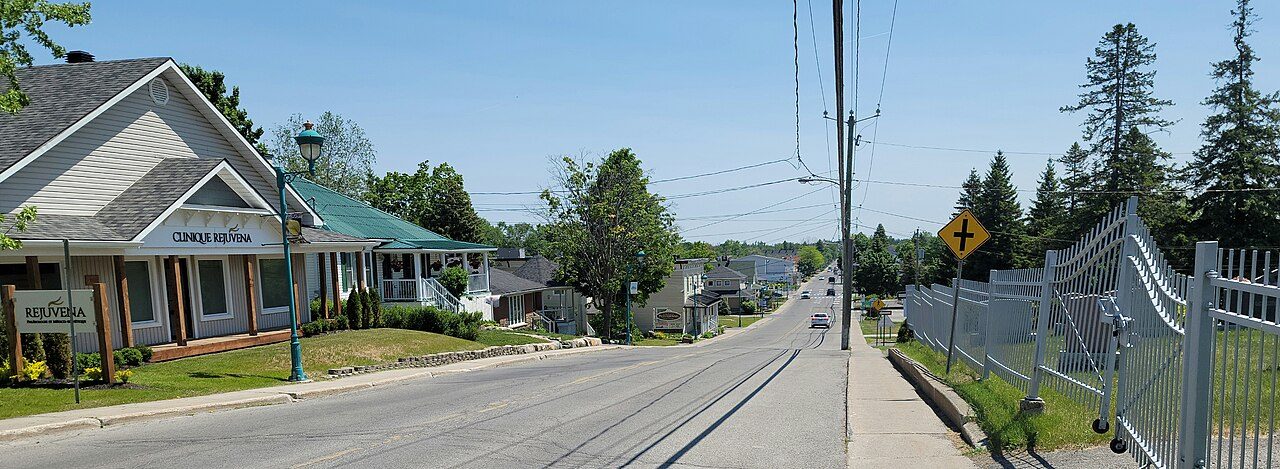
 Photo: Veillg1 · CC BY-SA 4.0
Saint-Lazare has less crime per resident than 86% of Canadian towns
Steady over the three years, the index read 39.8 in 2023 and 37.9 in 2025. Counting crime the police covering Saint-Lazare reported from 2023 to 2025, it grades A for safety: #53 of 503 in Quebec. What’s more, its police logs show 8.4 violent incidents and 10.4 incidents of property crime per 1,000 residents a year, while in the typical town its size the numbers are 12.0 and 30.5. Split in two, the index gives 61.7 for violence and 30.5 for everything else (normally 89.4 and 56).
Statistics Canada, police-reported crime, 2023–2025 means. The index weighs each crime by its seriousness; rates are incidents per 1,000 residents a year. Area behind the crime severity, crime rate and incident counts figures: the Vaudreuil-Soulanges MRC.
What stands out about safety in Saint-Lazare
A high clearance rate
The weighted clearance rate, the share of crime police solve, is 49% for Saint-Lazare (69% violent, 34% non-violent), beside 33% for Canadian towns of 10,000 to 50,000 people. Questions ↓
Lighter than Quebec’s middle
Saint-Lazare’s index of 39.2 compares with 56.1 for the typical town in Quebec. Towns its size ↓
Lower than many towns its size
Of the 40 Canadian towns nearest it in size, Saint-Lazare places 10th from the lowest index. Towns its size ↓
Written from Statistics Canada’s police-reported crime by police service and detachment, 2023–2025. Figures are what police recorded, not convictions.
What’s behind Saint-Lazare’s grade
The grade weighs the Crime Severity Index and its violent half, averaged over 2023–2025, against every Canadian town and city neighbourhood of 1,000 people or more.
Its place: #53 of 503 in Quebec and #279 of 2,572 Canadian towns.
The Crime Severity Index and its two halves, beside the typical figure for Canadian towns of 10,000 to 50,000 people.
Crime in Saint-Lazare, type by type
Mischief and theft under $5,000 sit below it.
Every Statistics Canada violation line
| Violation | Incidents a year | Per 1,000 | Cleared |
|---|---|---|---|
| Homicide | 2.7 | 0.02 | — |
| Sexual violations against children | 60.3 | 0.4 | 53% |
| Assaults against a peace officer | 47.3 | 0.3 | 93% |
| Firearms: use, discharge, pointing | 6 | 0.04 | 67% |
| Robbery | 23 | 0.1 | 43% |
| Forcible confinement or kidnapping | 20 | 0.1 | 100% |
| Other violent violations | 37 | 0.2 | 68% |
| Breaking and entering | 175 | 1 | 18% |
| Possession of stolen property | 74 | 0.4 | 86% |
| Theft of a motor vehicle | 237.3 | 1.4 | 16% |
| Theft over $5,000 | 52.7 | 0.3 | 15% |
| Theft under $5,000 | 412.7 | 2.4 | 29% |
| Mischief | 269.7 | 1.6 | 21% |
| Weapons violations | 21 | 0.1 | 99% |
| Administration of justice violations | 262.7 | 1.6 | 94% |
| Other Criminal Code violations | 58.7 | 0.3 | 72% |
| Drug violations | 78 | 0.5 | 88% |
| Impaired driving | 271.7 | 1.6 | 100% |
| Failing to stop or remain | 294 | 1.7 | 14% |
Statistics Canada’s violation groups for the whole police service or detachment, incidents a year its own. Cleared: incidents solved by a charge or otherwise, as a share of those reported.
Incidents per 1,000 residents a year, 2023–2025 means, against the typical figure for Canadian towns of 10,000 to 50,000 people.
By its index, Saint-Lazare stands 10th of 40 towns its size
| # | Town | People | Severity index | Violent index | Safety |
|---|---|---|---|---|---|
| 1 | Springwater Ontario | 24,144 | 22.8 | 21.7 | A+ |
| … | |||||
| 7 | Sainte-Marthe-sur-le-Lac Quebec | 21,949 | 30.8 | 56.8 | A+ |
| 8 | Varennes Quebec | 21,490 | 37.1 | 58.5 | A |
| 9 | Essex Ontario | 23,872 | 37.3 | 63.2 | A |
| 10 | Saint-Lazare Quebec | 22,895 | 39.2 | 61.7 | A |
| 11 | Candiac Quebec | 24,920 | 41.6 | 59.8 | A− |
| 12 | Port Perry Ontario | 23,928 | 45.8 | 61.4 | A− |
| 13 | Uxbridge Ontario | 22,618 | 45.8 | 61.4 | A− |
| … | |||||
| 16 | Saint-Lambert Quebec | 23,355 | 53.7 | 69.5 | B |
| … | |||||
| 20 | Saint-Augustin-de-Desmaures Quebec | 20,864 | 63 | 89.4 | B− |
| 21 | Joliette Quebec | 22,408 | 68.5 | 107.8 | B− |
| … | |||||
| 27 | Mont-Royal Quebec | 22,821 | 80.3 | 115.7 | C |
| … | |||||
| 40 | Yellowknife Northwest Territories | 22,858 | 304.6 | 362 | D− |
The 40 Canadian towns of 2,500+ people closest in population; city neighbourhoods, city totals and reserves are left out. Towns on one police service or detachment share its index.
The Canadian towns closest to Saint-Lazare in population, the lowest Crime Severity Index first (2023–2025 means).
About 1,430 violent incidents a year across the police area of 170,600 residents that includes Saint-Lazare, 2023–2025
Violent incidents per 1,000 a year, 2023–2025
Property crimes per 1,000 a year, 2023–2025
Statistics Canada counts actual incidents; those police record as unfounded are listed apart and kept out of its crime rates and severity index. Each incident is filed under its most serious violation, which the survey sets partly by the maximum penalty.
And about 1,760 property crimes, plus 1,130 other violations, a year (2023–2025 average). Each dot is one resident; each coloured dot, one incident a year at the area’s rates.
Saint-Lazare, year by year
Crime Severity Index
The middle year, 2024, was the heaviest at 39.9; 2025 was lightest, at 37.9. The comparison line, the typical Canadian town its size, runs from 69.5 in 2023 to 60 by 2025.
Every year as a table
| Year | Saint-Lazare | Typical town its size |
|---|---|---|
| 2025 | 37.9 | 60 |
| 2024 | 39.9 | 67.9 |
| 2023 | 39.8 | 69.5 |
Statistics Canada, Crime Severity Index by police service, each year as published. Typical: the median of Canadian towns of 10,000 to 50,000 people.
The Crime Severity Index of the police covering Saint-Lazare, each year, against the typical Canadian town its size.
Crime in the places around Saint-Lazare
| Town | People | Severity index | Violent index | Safety |
|---|---|---|---|---|
| Saint-Lazare | 22,895 | 39.2 | 61.7 | A |
| Hudson | 5,533 | 39.2 | 61.7 | A |
| Saint-Clet | 1,784 | 39.2 | 61.7 | A |
| Vaudreuil-Dorion | 46,413 | 39.2 | 61.7 | A |
| Vaudreuil-sur-le-Lac | 1,340 | 39.2 | 61.7 | A |
| Kanesatake | 1,872 | 83 | 129.3 | C |
| Sainte-Marthe | 1,065 | 39.2 | 61.7 | A |
5 places nearby are policed together with it and reported as one, so there is nothing to compare.
Each place’s police figures, 2023–2025 means.
What this data can and can’t tell you
- One figure for the MRC. The Sûreté du Québec reports by MRC, so the figures cover every municipality it polices there, Saint-Lazare among them.
- What 100 means. The index is scaled so that Canada as a whole scored 100 in its base year, 2006: a town at 50 has half that severity per resident.
- The clearance rate. A cleared case is one police consider solved. Whether anyone is convicted is a separate matter the rate doesn’t follow.
- Severity, weighed. Each incident counts by its seriousness, judged from court sentences, and the total is set per resident. As Statistics Canada puts it, “The CSI is not an indicator of overall safety and should be interpreted in the broader community context.”
Questions about safety in Saint-Lazare
Is Saint-Lazare safe?
Against a typical 66 for Canadian towns of 10,000 to 50,000 people, Saint-Lazare’s Crime Severity Index stands at 39.2 for 2023–2025. Its police record 8.4 violent incidents and 10.4 property crimes per 1,000 residents a year.
What is the most common crime in Saint-Lazare?
Assault is the most common, at 4.2 per 1,000 residents a year, then Criminal Code traffic offences (4) and fraud (3).
Is crime going up in Saint-Lazare?
Barely: 39.8 in 2023, 37.9 in 2025.
How much of Saint-Lazare’s crime do police solve?
About 49% of crime is cleared, weighted by seriousness, with 69% of violent and 34% of other crime; the figure for the typical Canadian town its size is 33%.
Whose figures are these?
A police service or detachment that covers Saint-Lazare and other places, so the figures are shared.
Source: Statistics Canada, police-reported crime by police service and detachment, 2023–2025 (Statistics Canada Open Licence); TownRatings calculation.
Sources: Statistics Canada, Crime severity index and weighted clearance rates, police services (tables 35-10-0186 to 0190, 0061, 0063, 0064), 2023–2025 · Statistics Canada, Incident-based crime statistics by detailed violations, police services (35-10-0178 to 0185) · Safety Grade: TownRatings calculation. Under the Statistics Canada Open Licence.
Adapted from Statistics Canada (Census of Population 2021, population estimates 2025, 2021 census boundaries) under the Statistics Canada Open Licence; this does not constitute an endorsement by Statistics Canada. Neighbourhood names in some cities © OpenStreetMap contributors (ODbL).