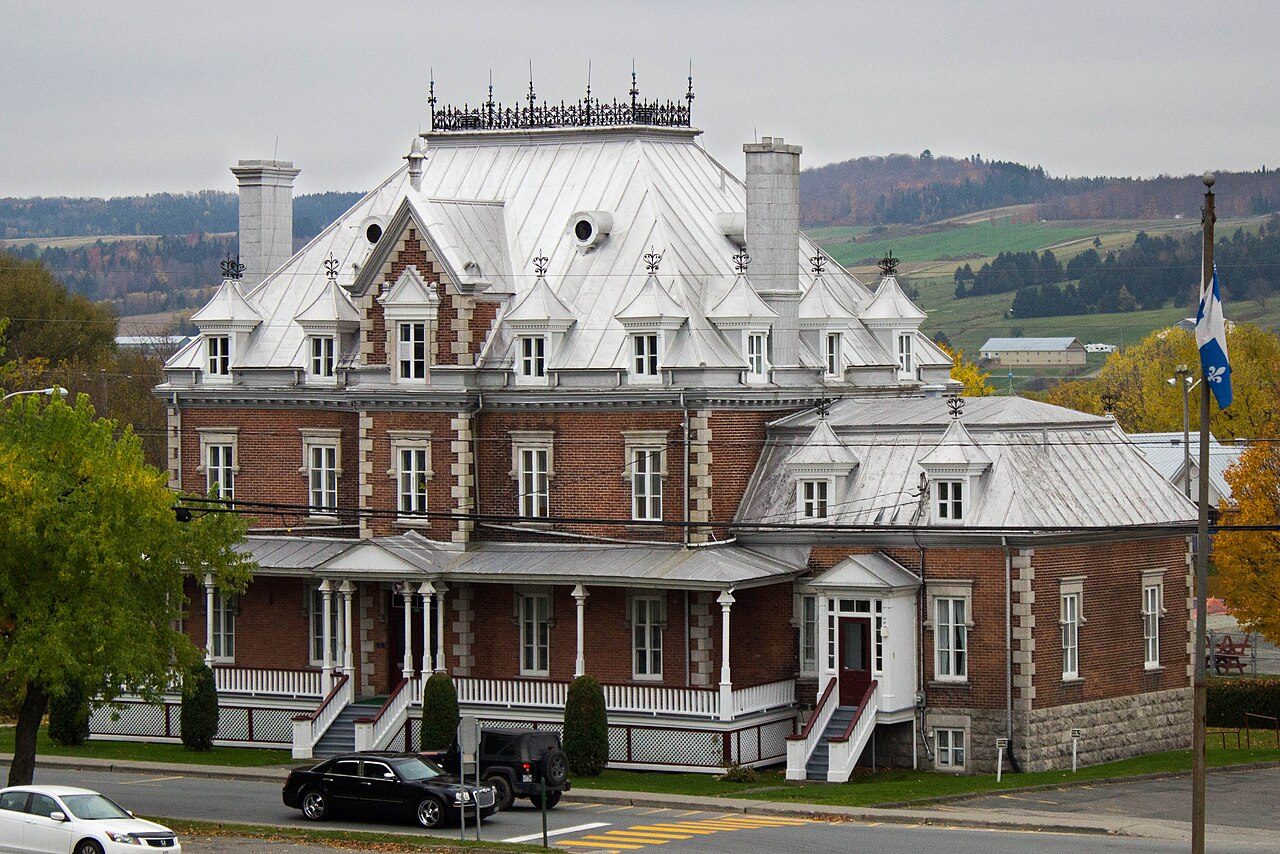
 Photo: SamuelFreli · CC BY-SA 3.0
Protected land is absent from the 10 km around Saint-Joseph-de-Beauce
Within 5 km are 3 beaches; Battures Têtes de Rouche is the nearest. No national park lies within 100 km. A provincial park, Frontenac National Park (Québec), lies 40 km away.
Saint-Joseph-de-Beauce beside other Canadian towns, figure by figure
Each figure against the 2,611 Canadian towns and neighbourhoods of 2,500+ (not city hubs or reserves), with the town marked and the typical one’s line. Canada’s grades don’t include the outdoors, so this page compares the figures rather than grading them.
CPCAD 2.9.0 (ECCC, 2026), OpenStreetMap (November 2026). Distances from the town’s outline.
Among 40 towns its size, Saint-Joseph-de-Beauce is 6th from the bottom for protected land
The 40 Canadian towns nearest in population (5,243 to 5,434 residents), by the share of the land within 10 km that is protected. Hover for each one’s figures; click for its page.
Where Saint-Joseph-de-Beauce trails its peers is public protected areas; 33 of 39 have more.
Every town in the comparison
| Town | Protected within 10 km | In town | Areas | Routes | Beaches | |
|---|---|---|---|---|---|---|
| 1 | Sainte-Anne-de-Bellevue QC | 43% | 33% | 45 | 0 | 10 |
| 2 | Inverness County, Subdivision A NS | 29% | 40% | 156 | 2 | 35 |
| 3 | Electoral Area H, Central Kootenay BC | 25% | 28% | 28 | 1 | 4 |
| 4 | Oliver BC | 19% | 0.8% | 24 | 0 | 1 |
| 5 | Upper Tantallon NS | 13% | 19% | 157 | 3 | 12 |
| 6 | Billings Bridge - Heron Park ON | 11% | 2.4% | 35 | 1 | 1 |
| 7 | Burton NB | 9.5% | 2% | 36 | 0 | 7 |
| 8 | Saint-Denis-de-Brompton QC | 9.4% | 1.6% | 19 | 2 | 3 |
| 9 | Electoral Area L, Cariboo BC | 9.1% | 9.1% | 12 | 0 | 0 |
| 10 | Central Frontenac ON | 8.2% | 8.2% | 39 | 1 | 7 |
| 11 | The Ravines of Rainbow Creek ON | 6.9% | 8.2% | 9 | 0 | 0 |
| 12 | Gourley ON | 6.5% | 0% | 17 | 0 | 0 |
| 13 | Uplands SK | 5.4% | 0% | 5 | 0 | 0 |
| 14 | Electoral Area B, Central Kootenay BC | 4.5% | 7.4% | 12 | 0 | 0 |
| 15 | Woodlands AB | 3.9% | 9.6% | 4 | 0 | 4 |
| 16 | Aldergrove AB | 3.7% | 0% | 8 | 0 | 0 |
| 17 | Saint-Boniface QC | 3.1% | 0% | 13 | 5 | 4 |
| 18 | West Meadowlark Park AB | 2.5% | 0% | 7 | 0 | 0 |
| 19 | Metcalfe ON | 1.9% | 0% | 13 | 0 | 3 |
| 20 | Southdale ON | 1.9% | 0% | 22 | 0 | 0 |
| 21 | Waverley Heights MB | 1.7% | 0% | 22 | 0 | 1 |
| 22 | Normand Park MB | 1.5% | 3.1% | 18 | 0 | 1 |
| 23 | South West Industrial SK | 1.4% | 0% | 19 | 0 | 1 |
| 24 | Mount Royal SK | 1.3% | 0% | 16 | 0 | 3 |
| 25 | Windsor QC | 1% | 0% | 4 | 0 | 0 |
| 26 | Headingley MB | 1% | 0% | 10 | 1 | 37 |
| 27 | Westdale MB | 1% | 1% | 10 | 0 | 37 |
| 28 | Saint-Jean-de-Matha QC | 0.7% | 0.1% | 6 | 0 | 0 |
| 29 | St. Boniface Industrial Park MB | 0.6% | 0.1% | 19 | 0 | 0 |
| 30 | Deer Lake NL | 0.4% | 3.8% | 2 | 0 | 6 |
| 31 | Mandalay West MB | 0.4% | 0% | 8 | 0 | 0 |
| 32 | Norwood ON | 0.3% | 0% | 4 | 1 | 0 |
| 33 | Belmont AB | 0.2% | 0% | 2 | 1 | 0 |
| 34 | Kirkness AB | 0.2% | 0% | 2 | 1 | 1 |
| 35 | Saint-Joseph-de-Beauce QC | 0% | 0% | 0 | 0 | 3 |
| 36 | Chisasibi QC | 0% | 0% | 0 | 0 | 4 |
| 37 | Wingham ON | 0% | 0.2% | 3 | 2 | 0 |
| 38 | Carstairs AB | 0% | 0% | 0 | 0 | 0 |
| 39 | Westlock AB | 0% | 0% | 0 | 0 | 0 |
| 40 | Belvedere AB | 0% | 0% | 0 | 0 | 0 |
Parks, woods and paths around Saint-Joseph-de-Beauce
Green space, woods, protected areas and footpaths in and around the town; tap a number for its park or wood.
One park or wood to walk in, in or near Saint-Joseph-de-Beauce
The biggest is Parc municipal, 12 ha. Biggest first, numbered as on the map.
Source: OpenStreetMap parks, gardens, commons and woods with a name, in the town or within 400 m, © OpenStreetMap contributors, ODbL. Sizes are the mapped outline’s.
2 in 10 people in Saint-Joseph-de-Beauce live near a park
Residents of each 2021 dissemination area, at a point inside it, within 400 m (about a 5-minute walk) of a park or playing field mapped on OpenStreetMap.
The usual figure for a Canadian town is 83%, above this. For about 4,300 people, the nearest park is over 400 m away.
Within 10 km of Saint-Joseph-de-Beauce, no land is protected
Every protected and conserved area in CPCAD within 10 km of the town’s edge: parks, reserves, wildlife areas and conservation land.
The nearest provincial park is Frontenac National Park (Québec), 40 km away.
Source: Canadian Protected and Conserved Areas Database (CPCAD) 2.9.0, Environment and Climate Change Canada. Contains information licensed under the Open Government Licence – Canada.
Frontenac National Park (Québec), 40 km off
National parks (Parks Canada) and provincial or territorial parks by direction and distance from the town’s edge: every one within 10 km, and the nearest of each within 100 km.
Frontenac National Park (Québec)
No national park lies within 100 km of Saint-Joseph-de-Beauce; the provincial parks are the big protected land within reach. In Québec, a parc national is a provincial park (Sépaq), not one of Parks Canada’s.
Source: CPCAD 2.9.0 (ECCC): areas and outlines, distances outline to outline; directions from the town’s centre point.
Saint-Joseph-de-Beauce has 19 km of footpaths in and around it
OpenStreetMap footpaths, paths, bridleways and steps, and tracks open on foot, in the town and 1 km around it; woods as mapped (landuse=forest, natural=wood).
Footpaths · km per km²
Share of the land · mapped woods and forest
Paths are thinner on the ground than in 84% of Canadian towns. Woods cover more of it than in 86% of Canadian towns.
Source: OpenStreetMap, © OpenStreetMap contributors, ODbL. Mapping varies by place: a dense figure can mean keen local mappers as much as many paths.
OpenStreetMap shows no walking route near Saint-Joseph-de-Beauce
Named walking and hiking routes on OpenStreetMap with at least 300 m within 2 km of the town, longest first; national routes lead.
There is no mapped walking route within 2 km of the town; a local trail club’s maps may show more.
Source: OpenStreetMap (route relations hiking, foot and walking), © OpenStreetMap contributors, ODbL. Trans Canada Trail sections as OSM maps them.
Saint-Joseph-de-Beauce is best on foot in May and September
Daylight at the town’s latitude and ECCC’s 1991–2020 normals (ST Georges, 22 km away). Good months: long days, highs of 15–30 °C, light rain.
| Jan | Feb | Mar | Apr | May | Jun | Jul | Aug | Sep | Oct | Nov | Dec | |
|---|---|---|---|---|---|---|---|---|---|---|---|---|
| Daylight (h) | 9.0 | 10.3 | 11.8 | 13.5 | 15.0 | 15.8 | 15.4 | 14.2 | 12.5 | 10.8 | 9.3 | 8.6 |
| High (°C) | -6 | -4 | 2 | 10 | 18 | 23 | 25 | 25 | 20 | 12 | 5 | -2 |
| Rain & snow (mm) | 67 | 52 | 57 | 89 | 91 | 105 | 128 | 115 | 88 | 107 | 73 | 81 |
In July the typical high is 25 °C; in January, -6 °C. Rain peaks with the heat: 128 mm in July, against 52 mm in February. A typical year sees 202 cm of snow. The climate in Saint-Joseph-de-Beauce →
For a swim near Saint-Joseph-de-Beauce: Battures Têtes de Rouche, 0.3 km off
Beaches on OpenStreetMap within 5 km of the town’s edge, nearest first, with directions.
Another 2 have no name on the map. Canada publishes no open register of beach water tests; the local public health unit posts swimming advisories.
Source: OpenStreetMap (natural=beach), © OpenStreetMap contributors, ODbL.
6 waterfalls near Saint-Joseph-de-Beauce
Viewpoints, peaks, waterfalls, picnic sites, nature reserves, playgrounds, dog parks, campsites and boat launches mapped within 2 km of the town.
Most numerous: waterfalls (6). Among the peaks, La Petite Montagne is highest at 419 m.
Every named place, with directions
Hills and peaks 2
Waterfalls 6
Plus 6 waterfalls without a name on the map.
Picnic sites 1
Plus 1 picnic site without a name on the map.
Playgrounds 4
Plus 4 playgrounds without a name on the map.
Campsites 2
Plus 2 campsites without a name on the map.
Slipways 1
Plus 1 slipway without a name on the map.
Source: OpenStreetMap (tourism, natural, waterway and leisure tags), © OpenStreetMap contributors, ODbL.
Next to Saint-Joseph-de-Beauce
The nearest places, coloured by the share of the land within 10 km that is protected; tap one for its outdoors page.
| Town | Protected within 10 km | Areas | Routes | Beaches |
|---|---|---|---|---|
| Saint-Joseph-de-Beauce | 0% | 0 | 0 | 3 |
| Saint-Frédéric 8.3 km | 0% | 0 | 0 | 3 |
| Vallée-Jonction 8.4 km | 0% | 0 | 0 | 3 |
| Saints-Anges 9.6 km | 0% | 0 | 0 | 0 |
| Tring-Jonction 12 km | 0% | 0 | 0 | 0 |
| Beauceville 12 km | 0.1% | 1 | 0 | 4 |
| Saint-Odilon-de-Cranbourne 16 km | 0% | 1 | 0 | 0 |
For protected land, no neighbour of Saint-Joseph-de-Beauce doubles its share.
What this data can and can’t tell you
- National and provincial parks. The nearest national park and the nearest provincial park are always shown when they are within 100 km.
- Walking routes. A route counts when 300 m or more of it lies within 2 km of the town. Coverage of trails on OpenStreetMap varies by region.
- Protected land. Measured on CPCAD’s outlines: the part of a 10 km band around the town that lies in a protected or conserved area, water included.
- Beaches. A beach counts when its centre point lies within 5 km of the town’s outline. Names come from the map.
- Private land. Areas held by land trusts or private owners stay unnamed here, though they count in the shares.
Questions about the outdoors in Saint-Joseph-de-Beauce
What is the nearest provincial park to Saint-Joseph-de-Beauce?
It is Frontenac National Park (Québec), 40 km away.
When should you visit Saint-Joseph-de-Beauce for the outdoors?
May and September, on the 1991–2020 normals and the daylight: long days, highs of 15 °C or more, light rain for the place.
Is there a beach near Saint-Joseph-de-Beauce?
Try Battures Têtes de Rouche, 0.3 km from town, first of several.
How far is Saint-Joseph-de-Beauce from a national park?
The nearest national park is more than 100 km from Saint-Joseph-de-Beauce.
Sources for this page on Saint-Joseph-de-Beauce
Protected areas: Canadian Protected and Conserved Areas Database (CPCAD) 2.9.0, Environment and Climate Change Canada, 2026: every area within 10 km and the nearest national and provincial parks, measured outline to outline.
Walking routes and beaches: OpenStreetMap, November 2026: named hiking, foot and walking route relations within 2 km and beaches within 5 km.
Towns: Statistics Canada 2021 Census boundaries and populations; the comparison is the Canadian towns and neighbourhoods of 2,500+, not city hubs or reserves.
When to go: Environment and Climate Change Canada, Canadian Climate Normals 1991–2020, from the nearest station that publishes them.
Green space, paths, woods, things to do: OpenStreetMap (Geofabrik’s Canada extract), November 2026: parks, gardens, playing fields, woods, footpaths, the coastline and things to do in and around each town.
Residents: Statistics Canada 2021 Census dissemination areas (population, boundaries), each at a point inside it.
Walking routes and beaches © OpenStreetMap contributors, available under the Open Database Licence (ODbL).
Not on this page: trailheads and trail grades, and beach water quality. No open Canadian dataset gives these for every town yet.
Adapted from Statistics Canada (Census of Population 2021, population estimates 2025, 2021 census boundaries) under the Statistics Canada Open Licence; this does not constitute an endorsement by Statistics Canada. Neighbourhood names in some cities © OpenStreetMap contributors (ODbL).