
Saint-CuthbertQuebec
Its census division is D'Autray. The town has 1,865 residents and lies in Quebec.
Is Saint-Cuthbert a good place to live?
People here tend to be in good health (B). Its lowest grade is for jobs & income (C−). Few people walk, cycle or take the bus to work (C). Elsewhere it is close to typical: B for safety and B for hazard risk.
Saint-Cuthbert has subject grades but no overall grade: Canadian towns get one from 2,500 residents.
This town's rent is the 2021 census rent scaled to 2025 by its province's ratio of surveyed to census rents: no rental survey covers it, so its Cost Grade is less sure. Safety is the Sûreté du Québec unit's figure for the whole MRC. No School Grade: this province doesn't publish comparable results school by school. Health is graded on the health region's survey figures and life expectancy, with the distance to hospital giving the town its own spread.
How Saint-Cuthbert grades
Each subject compares Saint-Cuthbert with Canadian towns of 2,500 or more, ordered by how far it is from the middle. Towns in other countries are graded separately.
Saint-Cuthbert has subject grades but no overall grade: Canadian towns get one from 2,500 residents.
How TownRatings grades Canadian towns →
What makes Saint-Cuthbert stand out
The 3 things Saint-Cuthbert does most differently from other towns.
The data
Data highlights are ordered by what stands out in Saint-Cuthbert.
Saint-Cuthbert has lower household incomes than four in five Canadian towns
The car took 94% of commuters, higher than both Quebec’s towns (90%) and Canadian towns (89%). The commute to work averages 29 min.
How working residents got to work · census 2021
| Census 2021 | Saint-Cuthbert | Quebec | Canada |
|---|---|---|---|
| Average trip | 29 min | 27 min | 26 min |
| Car or van | 94% | 90% | 89% |
Statistics Canada, Census 2021 (labour and commuting) · The 2021 census was taken in May 2021, during COVID-19 restrictions: more people than usual worked from home or were off work.
56% of adults around Saint-Cuthbert rate their health very good or excellent
14% of adults smoke, daily or now and then, above both Quebec’s towns (12%) and Canadian towns (12%). For 2022/2024, the region’s figure is 82.0 years at birth, 83.7 for women and 80.3 for men. Closer to home, a hospital is 18 km from the average resident of Saint-Cuthbert, further than the usual 3.7 km.
Very good or excellent health · adults, age-standardised
| Health | Saint-Cuthbert | Quebec | Canada |
|---|---|---|---|
| Chronic conditions (average share) | 15% | 15% | 17% |
| Smokers | 14% | 12% | 12% |
| Very good or excellent health | 56% | 56% | 52% |
| Life expectancy at birth | 82.0 | 82.5 | 81.5 |
Statistics Canada, Canadian Community Health Survey 2023/2024 and life expectancy 2022/2024; Open Database of Healthcare Facilities · Health survey and life expectancy published for the Région de Lanaudière, not by town
Saint-Cuthbert households put 20% of their income into housing and transport, less than the 29% typical across Canada
Owners make up 78% of households, above Quebec’s towns (70%) and Canadian towns (74%) alike. Shelter took 30% or more of income for 11% of households, below Quebec’s towns (13%) and Canadian towns (18%) alike.
What homes were worth · The median owner’s estimate at the 2021 census
| Census 2021 | Saint-Cuthbert | Quebec | Canada |
|---|---|---|---|
| Households spending 30%+ on shelter | 11% | 13% | 18% |
| Households owning their home | 78% | 70% | 74% |
| Rent as a share of income | 20% | 18% | 20% |
Statistics Canada, Census 2021; CMHC Rental Market Survey via Statistics Canada · The 2021 census asked owners what their home was worth; those values, and 2020 incomes, are what this compares.
Wet weather: 1,109 mm of rain and snow a year falls on Saint-Cuthbert, more than on 82% of Canadian towns
A normal December brings 49 cm of snow, the most of any month. For the wettest month, look to August: 114 mm on average. Summer highs average 26.6°C in July, about level with Quebec’s towns (26.5°C) and above Canadian towns (25.5°C). Saint-Cuthbert sees January nights of −16.0°C on average.
Average high by season · ECCC normals, 1991–2020
| Normals, 1991–2020 | Saint-Cuthbert | Quebec | Canada |
|---|---|---|---|
| Precipitation a year | 1,109 mm | 1,041 mm | 883 mm |
| Snowfall a year | 202 cm | 217 cm | 141 cm |
| July afternoon high | 26.6°C | 26.5°C | 25.5°C |
| January night low | −16.0°C | −14.7°C | −13.5°C |
Environment and Climate Change Canada, Canadian Climate Normals 1991–2020 (L'Assomption)
La Mauricie National Park is 47 km from Saint-Cuthbert
54 protected areas lie within 10 km. The largest named area nearby is Îles de la Girodeau - Grande Île Water Fowl Gathering Area, 4,676 ha, 4.6 km away. Of the country within 10 km, 7% lies in protected areas; the median Canadian town has 2.3%. A provincial park, Mont-Tremblant National Park (Québec), lies 46 km away.
Protected land · of the land within 10 km
| Outdoors | Saint-Cuthbert | Quebec | Canada |
|---|---|---|---|
| Protected land within 10 km | 7% | 4.9% | 2.3% |
| Public protected areas within 10 km | 15 | 10 | 4 |
Canadian Protected and Conserved Areas Database (CPCAD), OpenStreetMap routes and beaches
Flood mapping exists for Saint-Cuthbert: 1 on record, latest by Gouvernement du Québec
Shaking is a bigger worry than in most places, at $0.12 a year per $1,000 of building value ($0.030 typical). Fewer homes than usual carry radon here, 3.9% over the guideline where the typical town has 6.6%.
Radon tests above the guideline · share of tested homes, 200 Bq/m³
| Hazards | Saint-Cuthbert | Quebec | Canada |
|---|---|---|---|
| Radon tests above the guideline | 3.9% | 8.2% | 6.6% |
| Earthquake loss per $1,000 of buildings a year | $0.12 | $0.14 | $0.030 |
NRCan seismic risk model and burned areas, Health Canada radon survey, the Flood Hazard Map Inventory · Not measured by town: radon tests (the Lanaudiere health region)
Saint-Cuthbert skews older, with 25% of residents 65 or over, more than Quebec’s towns or Canadian towns
24% speak both English and French, between Quebec’s towns (44%) and Canadian towns (7.5%). Children are 14% of the town.
Ages · Share of residents in each age group, Census 2021
Schooling · Highest qualification, residents 15 and over
Women and men · all residents
47.9% of Saint-Cuthbert’s residents are women
In 2021 there were 875 women to 950 men; Canada as a whole is 50.9% women.
| Saint-Cuthbert | Quebec | Canada | |
|---|---|---|---|
| Under 15 | 14% | 17% | 16% |
| 15 to 64 | 62% | 62% | 64% |
| 65+ | 25% | 20% | 19% |
| No certificate, diploma or degree | 31% | 19% | 16% |
| Postsecondary qualification | 47% | 59% | 56% |
Statistics Canada, Census 2021; Quebec and Canada: medians of towns of 2,500+
Saint-Cuthbert gets a B for safety
Area-wide: Crime Severity Index, Violent Crime Severity Index, violent crime and property crime per 1,000, counted over D'Autray MRC
Where it is policed, thefts, break-ins and damage came to 14.8 per 1,000 a year, lower than both Quebec’s towns (16.6) and Canadian towns (31.2). Across the area its police cover, the Crime Severity Index averaged 58 over 2023–25, about level with Quebec’s towns (56) and below Canadian towns (67).
Year by year · Crime Severity Index for each year
| 2023–2025 | Saint-Cuthbert | Quebec | Canada |
|---|---|---|---|
| Property crime per 1,000 | 14.8 | 16.6 | 31.2 |
| Crime Severity Index | 58 | 56 | 67 |
Statistics Canada, Uniform Crime Reporting Survey, 2023–2025 average
A normal November in Saint-Cuthbert runs from −3°C to 5°C
Hour-by-hour figures come from ECCC’s Berthierville forecast, on the Weather page. About 12 cm of snow falls in a normal November. Into December, the normals move to −2°C and −10°C. A normal November brings 90 mm of rain and snow.
Normal highs, the months ahead · ECCC normals, 1991–2020
| Season | High | Low | Rain and snow |
|---|---|---|---|
| Winter | −4°C | −14°C | 227 mm |
| Spring | 11°C | 0°C | 265 mm |
| Summer | 25°C | 14°C | 322 mm |
| Autumn | 13°C | 3°C | 295 mm |
ECCC normals, 1991–2020 (L'Assomption); the forecast is on the Weather page
Berthier—Maskinongé was won by 937 votes in 2021, a tighter race than 96% of ridings
Saint-Cuthbert’s council has 6 councillors and is led by Richard Belhumeur, the mayor.
Wikidata, MAMH, MMAH, Statistics Canada
Bibliothèque Adélard-Lambert is Saint-Cuthbert’s public library
The library is 3.4 km from the centre of Saint-Cuthbert.
Provincial library statistics, OpenStreetMap, the CRA and Statistics Canada
The nearest high school to Saint-Cuthbert is 11 km away
An elementary school stands 3.4 km from the centre, higher than both Quebec’s towns (0.5 km) and Canadian towns (0.5 km).
| School | Level | Students | System |
|---|---|---|---|
| École primaire Sainte-Anne (Sainte-Anne (Saint-Cuthbert))In Saint-CuthbertElementary | Elementary | – | French public |
| Schools within 3 km | Saint-Cuthbert | Quebec | Canada |
|---|---|---|---|
| Nearest secondary school | 11 km | 1.2 km | 1.2 km |
| Nearest elementary school | 3.4 km | 0.5 km | 0.5 km |
Provincial school lists and results, 2025-26 · Towns in Quebec aren’t in the schools rankings: the ministry publishes its success rates by school service centre, not school by school.
In Saint-Cuthbert, 43% of homes go back before 1961
Its 1 historic place is of the highest rank.
Historic places by designation · inside the town
Among them
| Heritage | Saint-Cuthbert | Quebec | Canada |
|---|---|---|---|
| Homes built before 1961 | 43% | 21% | 18% |
Canadian Register of Historic Places, Directory of Federal Heritage Designations, Québec’s Répertoire du patrimoine culturel, Wikidata; Census 2021 homes by period
Everything we know about Saint-Cuthbert
Cuthbert Chapel and 7 more within 40 km
2 places to visit are mapped within 5 km of Saint-Cuthbert; with them, the best known within 40 km.
 National historic siteCuthbert Chapel2.4 km outside town, to the southeast
 FortFort Richelieu17 km southeast
 CathedralSt Charles Borromeo Cathedral21 km southwest
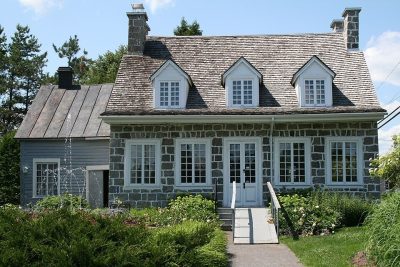 GardenMaison Antoine-Lacombe21 km southwest
 MuseumMusée d'art de Joliette21 km southwest
 MuseumCanadiana Village37 km southwest
Photos: each place’s Wikidata image, from Wikimedia Commons under the licence below (our copy, resized).
Photo credits (6)
- Cuthbert Chapel: Fralambert, CC BY 3.0, Wikimedia Commons
- Fort Richelieu: Fralambert, CC BY-SA 3.0, Wikimedia Commons
- St Charles Borromeo Cathedral: Fralambert, CC BY-SA 4.0, Wikimedia Commons
- Maison Antoine-Lacombe: Dreamdan, CC BY-SA 3.0, Wikimedia Commons
- Musée d'art de Joliette: Jaboileaumiss, CC BY-SA 4.0, Wikimedia Commons
- Canadiana Village: Conrad Poirier, Public domain, Wikimedia Commons
Famous people from Saint-Cuthbert
9 notable people were born in Saint-Cuthbert.
About Saint-Cuthbert
Town in Quebec
TownRatings counts Saint-Cuthbert as Statistics Canada does, as one municipality in Quebec; the census, crime and housing figures all follow that boundary.
Statistics Canada: population estimates 2025 (17-10-0155), Census of Population 2021, 2021 census boundaries.
- Population
- 1,865 (people, 2025 estimate)
- Province or territory
- Quebec
- Census division
- D'Autray
- Census subdivision
- 2452062
Saint-Cuthbert’s neighbours
The nearest places of 1,000 or more. Statistics Canada
| Town | People | km | Overall | Cost | Safety | Health |
|---|---|---|---|---|---|---|
| Saint-Cuthbert | 1,865 | — | — | C+ | B | B |
| Saint-Norbert | 1,143 | 6.8 | — | C | B | B |
| Saint-Barthélemy | 2,115 | 9 | — | B− | B | B |
| Sainte-Geneviève-de-Berthier | 2,298 | 9.8 | — | B | B | B+ |
| Berthierville | 4,591 | 11 | B− | C− | B | A− |
| Sainte-Élisabeth | 1,473 | 11 | — | B | B | B+ |
| Saint-Félix-de-Valois | 7,670 | 14 | B− | C | B | B+ |
People: Statistics Canada, Census 2021. Distances: centre to centre.
Questions about Saint-Cuthbert
Do people in Saint-Cuthbert speak French?
It is a French-speaking town: 76.4% know French alone, and 24% can talk in English too, against 8% for the median of Canadian towns.
What kind of homes are in Saint-Cuthbert?
Single-detached houses make up 86% of the homes here, where Canadian towns sit at 64%; 0% are in high-rise apartments. 33% of households are one person, and the average is 2.2.
Has Saint-Cuthbert grown?
It went from 1,862 people in 2016 to 1,821 in 2021, down 2.2%, while the median of Canadian towns grew 4.1%. StatCan’s 2025 estimate is 1,865.
Sources: Statistics Canada, Census of Population 2021 · population estimates 2025 (17-10-0155) and 2021 census boundaries · Uniform Crime Reporting Survey 2023–25 (35-10-0026, 35-10-0183 to 35-10-0190) · CMHC rents as published by Statistics Canada (34-10-0133) · grades by TownRatings. Under the Statistics Canada Open Licence.
Adapted from Statistics Canada (Census of Population 2021, population estimates 2025, 2021 census boundaries) under the Statistics Canada Open Licence; this does not constitute an endorsement by Statistics Canada. Neighbourhood names in some cities © OpenStreetMap contributors (ODbL).