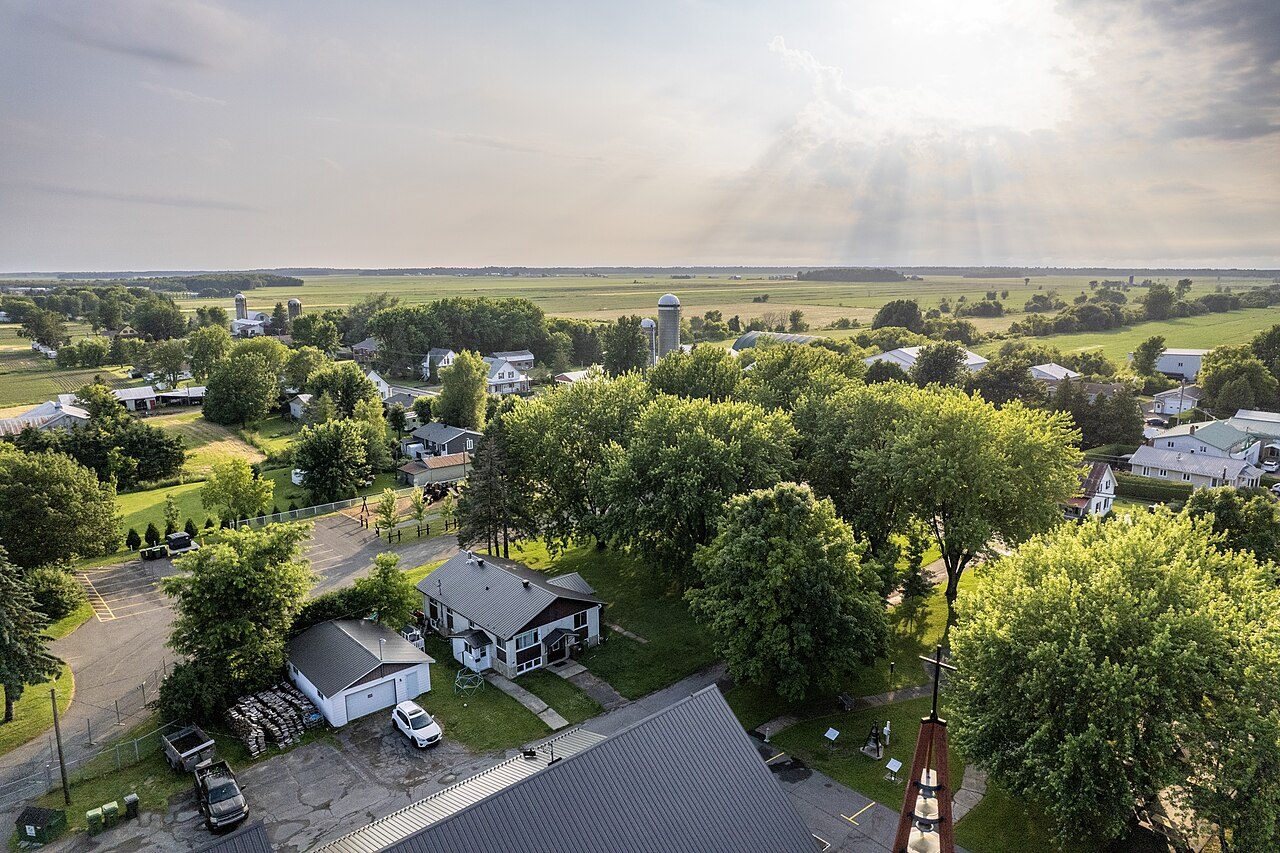
 Photo: Gabriel Picard · CC BY-SA 4.0
22% of residents are under 15, more than in 92% of Canadian towns
Nearly a quarter of residents said they have no religion (Canada’s towns: 35%). Statistics Canada puts Saint-Bonaventure’s population at 1,086 for July 2025. On the census count, 89% of households live in a single-detached house. Fewer immigrants than in 98% of Canadian towns: 0.9%.
What stands out about the people of Saint-Bonaventure
A town of families
Children under 15 are 22% of residents, more than in 92% of Canadian towns. Households average 2.5 people, and 4.7% are one-parent families. Ages ↓
Common-law couples
38% of residents 15 and over live common-law, more than in 99% of Canadian towns; 31% are married. Couples ↓
Written from the data on this page: Statistics Canada, 2021 Census.
A larger share of bilingual residents than 76% of Canadian towns: 23%
Unless a figure says otherwise, it is from the 2021 Census. Who can speak English and French, mother tongue, and the language spoken most at home.
Can hold a conversation in · share of all residents
Mother tongue · share of all residents
Residents whose mother tongue is English are rarer here than in 99% of Canadian towns. Elsewhere, 7.5% of residents speak English and French across Canada’s towns.
+3% since 2016, a pace below 54% of Canadian towns
The census counts of 2016 and 2021, the estimate after them, and the change set beside other towns.
Change, 2016 to 2021
Across Canada’s towns the median change is +4%; across Quebec’s towns, +4%. The July 2025 estimate adds another 2%.
A smaller share of residents aged 15 to 24 than 81% of Canadian towns: 8.9%
Every five-year age group as a share of residents; ticks mark the typical town.
The median age in Saint-Bonaventure is 40.8, lower than in 58% of Canadian towns. Elsewhere, 11% of residents are aged 15 to 24 across Canada’s towns. The census found that 18% of residents are 65 or over locally.
Broad ages · share of residents
Women and men · all residents
48% women, 52% men
About 107 men for every 100 women.
24% of households are one person living alone, fewer than in 59% of Canadian towns
Who shares a home: household types and sizes.
Against Quebec’s towns and Canada’s towns
People per household
Canada’s towns.
Against a figure of 8.2% across Canada’s towns, the share of one-parent families in Saint-Bonaventure comes in at 4.7%. Across the comparison, 27% of households are one person living alone across Canada’s towns. Each household has 2.5 people on average.
Above 99% of Canadian towns: 38% of residents 15 and over live common-law
How adults live as couples, or don’t, with common-law unions shown on their own.
Marital status · residents 15 and over
23% of adults are single and have never married; the typical town has 27%. For comparison, 11% of residents 15 and over live common-law across Canada’s towns.
Fewer renter households than 68% of Canadian towns: 17%
The kinds of homes people live in, who owns and who rents, and how old the homes are. Prices, rents and shelter costs are on Cost of living.
Type of home
Owners and renters · share of households
When homes were built · share of homes
Older homes outnumber new: 36% predate 1961, 9.3% date from 2001 or later. Across Canada’s towns, the share of renter households is 25%. Households in buildings of five or more storeys are rarer here than in nearly three quarters of Canadian towns.
$73,000 a year is the median household income here
Census incomes cover 2020, when emergency benefits like CERB lifted many households’ totals. Household income before tax: the median, and households by income group.
Households by income · share of households
Household incomes run lower in Saint-Bonaventure: half had less than $73,000, 15% under the median across Canada’s towns ($86,000). The middle household across Quebec’s towns has $74,000 before tax. COVID-19 benefits were paid to 27% of residents with an income, where the typical town had 28%.
A lower share of residents who moved in within the year than 61% of Canadian towns, at 9.9%
Birthplaces and arrival years of immigrants, citizenship and recent moves.
Immigrants, by continent of birth · share of all residents; the bar runs to 20%
When immigrants arrived · share of immigrants
Citizenship and moving · share of residents
Residents without Canadian citizenship are rarer here than in 99% of Canadian towns. Typically, 11% of residents lived at another address a year earlier across Canada’s towns.
77% said they are Christian and 24% that they have no religion
Residents’ own answers on visible minority, Indigenous identity and religion.
Visible minority and Indigenous identity · all residents
Religion · all residents
Across Canada’s towns, 15% of residents belong to a visible minority; in Saint-Bonaventure, 1.4%. Indigenous residents are rarer here than in 98% of Canadian towns.
A smaller share of degree holders aged 25 to 64 than 98% of Canadian towns: 7.8%
The highest diploma or degree of adults of working age (25 to 64).
Highest qualification · residents 25 to 64
In work on census day: 63% of adults
The census was taken in May 2021, during the pandemic, so these rates show a labour market still recovering. Four labour figures from the census. Jobs, industries and the commute are on Work & commute.
At 63%, more residents are in work than the typical 58% across Canada’s towns.
Saint-Bonaventure sits below 4 of its 6 closest neighbours on median age
Places nearby, shaded by median age, each linked to its page.
| Town | People | Away | Median age | 65+ | Immigrants |
|---|---|---|---|---|---|
| Saint-Bonaventure | 1,086 | — | 40.8 | 18% | 0.9% |
| Saint-Majorique-de-Grantham | 1,373 | 8.7 km | 40.8 | 16% | 0.7% |
| Saint-Guillaume | 1,489 | 9.4 km | 45.6 | 22% | 1.4% |
| Saint-Germain-de-Grantham | 5,054 | 14.5 km | 40.4 | 16% | 1.5% |
| Pierreville | 2,154 | 16.6 km | 51.6 | 28% | 0.7% |
| Saint-François-du-Lac | 1,927 | 16.7 km | 53.2 | 28% | 0.5% |
| Saint-Eugène | 1,180 | 17.0 km | 44 | 19% | 3.9% |
Health, work, housing and schools
What this data can and can’t tell you
- Against Quebec’s towns and Canada’s towns. Each comparison is its own median: over Quebec’s towns and neighbourhoods of 2,500 or more, and over all Canadian towns of that size (whole cities and First Nations reserves left out). Percentiles are within Canada only.
- What these tables don’t give. Not in the Census Profile: unpaid care, cars, internet access, and how each age group has changed since 2016. We also chart no ethnic origins besides visible minority and Indigenous identity.
- The census’s own words. The census takes “visible minority” from the Employment Equity Act: anyone other than Indigenous peoples who is non-white in colour or race. Indigenous identity, immigrant status and religion are what residents reported, compared here with other towns and never used as a label.
Questions about Saint-Bonaventure’s residents
What religion are people in Saint-Bonaventure?
77% are Christian and 24% have no religion; 0% follow another religion.
Is Saint-Bonaventure good for families?
Under 15: 22% (Canada’s towns: 16%). Couple families: 64% of households. One-parent families: 4.7%. Schools near Saint-Bonaventure are on its Schools page.
What is the median income in Saint-Bonaventure?
The median household in Saint-Bonaventure took in $73,000 in 2020, against $86,000 across Canada’s towns.
What is the population of Saint-Bonaventure?
Saint-Bonaventure had about 1,086 residents in July 2025, Statistics Canada estimates; the 2021 Census counted 1,066, 3% more than 2016.
What is the average age in Saint-Bonaventure?
A median age of 40.8. Children under 15 make up 22%, and people 65 and over 18%.
Is Saint-Bonaventure bilingual?
Both official languages are spoken by 23% of residents, against a typical 7.5% across Canada’s towns. 0% speak only English and 77% only French; 97% grew up with French.
How diverse is Saint-Bonaventure?
0.9% of residents are immigrants (Canada’s towns: 17%); 1.4% belong to a visible minority and 0% have an Indigenous identity.
Sources: Statistics Canada, Census Profile, 2021 Census of Population · Statistics Canada, population estimates for 1 July 2025 (table 17-10-0155). Under the Statistics Canada Open Licence.
Adapted from Statistics Canada (Census of Population 2021, population estimates 2025, 2021 census boundaries) under the Statistics Canada Open Licence; this does not constitute an endorsement by Statistics Canada. Neighbourhood names in some cities © OpenStreetMap contributors (ODbL).