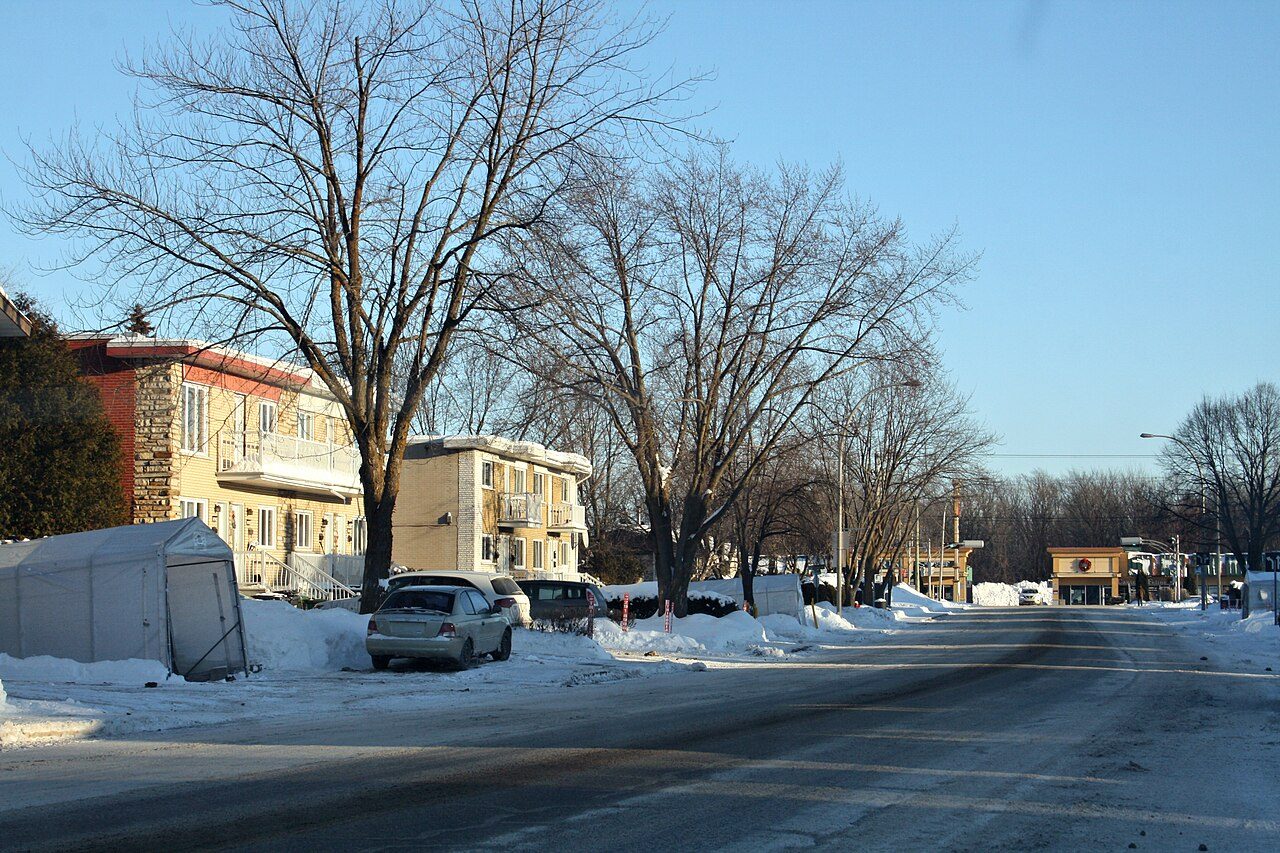
BoisbriandQuebec
Between 2016 and 2021, its population grew by 5%. It is a town of 29,830 residents in Quebec.
Is Boisbriand a good place to live?
Health is a strength (A+). It is easy to get around without a car (A−). Also worth knowing: the weak point is cost of living (C). Natural hazards weigh more here (D).
Boisbriand has no overall grade because safety isn’t graded here.
Rents here are the metro area's average, shared by every town and neighbourhood in it. No Safety Grade: no police service publishes a crime rate for this place on its own. No School Grade: this province doesn't publish comparable results school by school. Health is graded on the health region's survey figures and life expectancy, with the distance to hospital giving the town its own spread.
How Boisbriand grades
Each subject compares Boisbriand with Canadian towns of 2,500 or more, ordered by how far it is from the middle. Towns in other countries are graded separately.
Boisbriand has no overall grade because safety isn’t graded here.
How TownRatings grades Canadian towns →
What makes Boisbriand stand out
The 3 things Boisbriand does most differently from other towns.
The data
Data highlights are ordered by what stands out in Boisbriand.
Boisbriand is graded an A+ for health
Measured from where Boisbriand’s residents live, a hospital is 2.7 km away, near the 3.7 km most towns see. The three chronic conditions the survey tracks average 13% of adults, lower than both Quebec’s towns (15%) and Canadian towns (17%). Adults here are more upbeat about their health than the province: 60% very good or excellent, against 57% in Quebec. For 2022/2024, the region’s figure is 82.2 years at birth, 83.7 for women and 80.8 for men.
Very good or excellent health · adults, age-standardised
| Health | Boisbriand | Quebec | Canada |
|---|---|---|---|
| Very good or excellent health | 60% | 56% | 52% |
| Chronic conditions (average share) | 13% | 15% | 17% |
| Smokers | 11% | 12% | 12% |
| Life expectancy at birth | 82.2 | 82.5 | 81.5 |
Statistics Canada, Canadian Community Health Survey 2023/2024 and life expectancy 2022/2024; Open Database of Healthcare Facilities · Health survey and life expectancy: one figure for all of the Région des Laurentides
Boisbriand is graded a D for hazard risk
In Health Canada’s survey, one in ten homes tested in the area exceeded 200 Bq/m³ (6.6% typical). Earthquakes are expected to cost $0.20 a year for every $1,000 of buildings, above both Quebec’s towns ($0.14) and Canadian towns ($0.030). Flood mapping exists: a study by Gouvernement du Québec.
Radon tests above the guideline · share of tested homes, 200 Bq/m³
| Hazards | Boisbriand | Quebec | Canada |
|---|---|---|---|
| Earthquake loss per $1,000 of buildings a year | $0.20 | $0.14 | $0.030 |
| Radon tests above the guideline | 10% | 8.2% | 6.6% |
NRCan seismic risk model and burned areas, Health Canada radon survey, the Flood Hazard Map Inventory · Area behind the radon tests figures: the Laurentides health region
Home ownership in Boisbriand, 65%, runs below Quebec’s towns and Canadian towns
17% of households spent 30% or more of their income on shelter, between Quebec’s towns (13%) and Canadian towns (18%). A year’s rent came to nearly a fifth of the median household income, about level with Quebec’s towns (18%) and below Canadian towns (20%). Nobody publishes rent as a share of income and monthly rent for a two-bedroom for Boisbriand alone, so this card uses the figure for the Montréal metro area.
What homes were worth · The median owner’s estimate at the 2021 census
| Census 2021 | Boisbriand | Quebec | Canada |
|---|---|---|---|
| Households owning their home | 65% | 70% | 74% |
| Households spending 30%+ on shelter | 17% | 13% | 18% |
| Rent as a share of income | 19% | 18% | 20% |
Statistics Canada, Census 2021; CMHC Rental Market Survey via Statistics Canada · These are 2021 census values, as owners judged them, set against household income in 2020.
Household incomes in Boisbriand are higher than in 69% of Canadian towns
Workers spend 27 min getting to work, on average. Just over nine in ten commuters drove, near both Quebec’s towns (90%) and Canadian towns (89%).
How working residents got to work · census 2021
| Census 2021 | Boisbriand | Quebec | Canada |
|---|---|---|---|
| Average trip | 27 min | 27 min | 26 min |
| Car or van | 91% | 90% | 89% |
Statistics Canada, Census 2021 (labour and commuting) · These are May 2021 figures, gathered while COVID-19 kept many people home or out of work.
Boisbriand has warmer summer afternoons than 78% of Canadian towns
A normal October brings 103 mm of precipitation, more than any other month. Frost comes on 146 days a year, lower than both Quebec’s towns (161) and Canadian towns (159). Between the last spring frost, 29 April, and the first in autumn, 14 October, lie 167 days. Most of the snow comes in January, about 52 cm.
Average high by season · ECCC normals, 1991–2020
| Normals, 1991–2020 | Boisbriand | Quebec | Canada |
|---|---|---|---|
| Snowfall a year | 217 cm | 217 cm | 141 cm |
| July afternoon high | 26.7°C | 26.5°C | 25.5°C |
| Days with frost a year | 146 | 161 | 159 |
| Precipitation a year | 1,041 mm | 1,041 mm | 883 mm |
Environment and Climate Change Canada, Canadian Climate Normals 1991–2020 (Montréal Trudeau (Airport))
More people in Boisbriand speak English and French than in Quebec’s towns or Canadian towns: 52%
Children under 15 count for a fifth of the people here. Those 65 and older account for 15% of residents. Visible minorities make up 11% of the population, between Quebec’s towns (3.5%) and Canadian towns (15%).
Ages · Share of residents in each age group, Census 2021
Schooling · Highest qualification, residents 15 and over
Women and men · all residents
Women make up 50.6% of Boisbriand
By the 2021 count the town had 14,335 women and 13,975 men, while Canada has 50.9% women.
| Boisbriand | Quebec | Canada | |
|---|---|---|---|
| Under 15 | 20% | 17% | 16% |
| 15 to 64 | 65% | 62% | 64% |
| 65+ | 15% | 20% | 19% |
| No certificate, diploma or degree | 18% | 19% | 16% |
| Postsecondary qualification | 58% | 59% | 56% |
Statistics Canada, Census 2021; Quebec and Canada: medians of towns of 2,500+
A normal November in Boisbriand runs from −2°C to 6°C
In November, the normal is 84 mm of rain and snow. Then December: −1°C by day, −9°C at night. A typical November adds 16 cm of snow. Across the year, normals run from −14°C nights in January to 27°C afternoons in July.
Normal highs, the months ahead · ECCC normals, 1991–2020
| Season | High | Low | Rain and snow |
|---|---|---|---|
| Winter | −3°C | −12°C | 243 mm |
| Spring | 11°C | 1°C | 253 mm |
| Summer | 26°C | 15°C | 268 mm |
| Autumn | 13°C | 5°C | 277 mm |
ECCC normals, 1991–2020 (Montréal Trudeau (Airport)); the forecast is on the Weather page
One councillor per 3,310 residents: Boisbriand is more thinly represented than 94% of Quebec municipalities
Christine Beaudette is mayor of Boisbriand, with 8 councillors on the council.
Wikidata, MAMH, MMAH, Statistics Canada
Boisbriand has one public library, Bibliothèque municipale de Boisbriand
A single building, Bibliothèque municipale de Boisbriand, serves 29,530 people.
Provincial library statistics, OpenStreetMap, the CRA and Statistics Canada
Protected land at Boisbriand’s edge: rivière des Mille Îles - Île Morris Muskrat Habitat
One named trail is close: the Les parcours Boomerang. For a provincial park, Oka National Park (Québec) lies 15 km off. L'Île-Bizard man-made landscape (1,354 ha) is the biggest, 9.9 km from town. OpenStreetMap shows one beach within 5 km, without a name.
Protected land · of the land within 10 km
| Outdoors | Boisbriand | Quebec | Canada |
|---|---|---|---|
| Protected land within 10 km | 2.3% | 4.9% | 2.3% |
| Public protected areas within 10 km | 10 | 10 | 4 |
Canadian Protected and Conserved Areas Database (CPCAD), OpenStreetMap routes and beaches
Boisbriand’s schools come under 3 different boards
Its 3 km reach takes in 42 elementary schools, 14 secondary schools and 3 schools for every grade, all of Boisbriand’s schooling. Schooling in English is on offer at 2 of 59; in Quebec, one in ten schools teach in it.
| School | Level | Students | System |
|---|---|---|---|
| École de la ClairièreIn BoisbriandElementary | Elementary | – | French public |
| Collège Boisbriand 2016 IndependentIn BoisbriandSecondary | Secondary | – | Independent |
| École primaire Our Lady of Peace EnglishTeaches in EnglishElementary | Elementary | – | English public |
Schools by system · Schools within 3 km
| Schools within 3 km | Boisbriand | Quebec | Canada |
|---|---|---|---|
| School boards | 3 | 2 | 3 |
Provincial school lists and results, 2025-26 · Source note: the ministry publishes its success rates by school service centre, not school by school, so there’s no schools grade in Quebec.
Maison Jean-Charles-Dubois, from 1776, is Boisbriand’s oldest designated place
Inside the town the registers count 4 historic places. Before 1961 is when 4.8% of the homes went up, below Quebec’s towns (21%) and Canadian towns (18%) alike.
Historic places by designation · inside the town
Among them
| Heritage | Boisbriand | Quebec | Canada |
|---|---|---|---|
| Homes built before 1961 | 4.8% | 21% | 18% |
Canadian Register of Historic Places, Directory of Federal Heritage Designations, Québec’s Répertoire du patrimoine culturel, Wikidata; Census 2021 homes by period
Everything we know about Boisbriand
Jardin des oiseaux and 19 more in and around Boisbriand
From museums to parks and historic sites: Boisbriand’s places to visit and those just beyond its edge, most famous first.
 MuseumWater interpretation center1.8 km outside town, to the eastTheme parkTheme parkJardin des papillonsin townTheme parkTheme parkPlace des centenairesin townTheme parkTheme parkScène de la chauve-sourisin townTheme parkTheme parkScène des chablisin town
Photos: each place’s Wikidata image, from Wikimedia Commons under the licence below (our copy, resized).
Photo credits (1)
- Water interpretation center: Jeangagnon, CC BY-SA 3.0, Wikimedia Commons
Famous people from Boisbriand
5 notable people were born in Boisbriand.


Photo credits
Frédérique Dufort: Bull-Doser, Public domain · Isabelle Gagné: Isabelle Gagné, CC BY-SA 4.0
About Boisbriand
Town in Quebec
TownRatings follows Statistics Canada’s map: Boisbriand is one municipality in Quebec, figures and all.
Statistics Canada: population estimates 2025 (17-10-0155), Census of Population 2021, 2021 census boundaries.
- Population
- 29,830 (people, 2025 estimate)
- Province or territory
- Quebec
- Census division
- Thérèse-De Blainville
- Metro area
- Montréal
- Census subdivision
- 2473005
Boisbriand’s neighbours
The nearest places of 1,000 or more. Statistics Canada
| Town | People | km | Overall | Cost | Safety | Health |
|---|---|---|---|---|---|---|
| Boisbriand | 29,830 | — | — | C | — | A+ |
| Sainte-Thérèse | 27,253 | 3.3 | B | D | B+ | A+ |
| Rosemère | 14,198 | 4.9 | A | B | B+ | A+ |
| Fabreville | 48,457 | 5.2 | B+ | C+ | B | A |
| Sainte-Rose | 37,408 | 5.3 | A | B | B | A− |
| Saint-Eustache | 47,562 | 6.4 | B+ | C− | B | A+ |
| Blainville | 61,739 | 6.7 | A+ | B− | A | A+ |
People: Statistics Canada, Census 2021. Distances: centre to centre.
Questions about Boisbriand
Do people in Boisbriand speak French?
Almost everyone does. 52% are bilingual, where the median of Canadian towns is 8%, and 37.3% speak French and no English.
What kind of homes are in Boisbriand?
Mostly 47% single-detached houses (the median of Canadian towns: 64%), with 1% of homes in buildings of five or more storeys. Households hold 2.5 people on average, and 29% have just one.
Is Boisbriand growing?
Between the 2016 and 2021 censuses it went from 26,884 to 28,308 residents (up 5.3%; Canadian towns’ median: 4.1%), and Statistics Canada now estimates 29,830.
Sources: Statistics Canada, Census of Population 2021 · population estimates 2025 (17-10-0155) and 2021 census boundaries · CMHC rents as published by Statistics Canada (34-10-0133) · grades by TownRatings. Under the Statistics Canada Open Licence.
Adapted from Statistics Canada (Census of Population 2021, population estimates 2025, 2021 census boundaries) under the Statistics Canada Open Licence; this does not constitute an endorsement by Statistics Canada. Neighbourhood names in some cities © OpenStreetMap contributors (ODbL).