
RoncesvallesToronto
It is one of 158 neighbourhoods of Toronto. Population 14,725: a neighbourhood in Toronto.
Is Roncesvalles a good place to live?
On health it is strong (A). It also does well on walkability (A+). What holds it back is cost of living (D−). All told, that adds up to a B overall and a rank of #370 of 858 in Ontario. Set against the rest, it does better than 60% of Canadian towns.
Rents here are the metro area's average, shared by every town and neighbourhood in it. Safety uses the city's Crime Severity Index, scaled by this neighbourhood's own violent and property crime rates. Health is graded on the health region's survey figures and life expectancy, with the distance to hospital giving the town its own spread.
What makes Roncesvalles stand out
The 3 things Roncesvalles does most differently from other towns.
How Roncesvalles grades
Each subject compares Roncesvalles with Canadian towns of 2,500 or more, ordered by how far it is from the middle. Towns in other countries are graded separately.
How TownRatings grades Canadian towns →
Armova Curatorial and 117 more in and around Roncesvalles
From museums to parks and historic sites: Roncesvalles’s places to visit and those just beyond its edge, most famous first.
 Big drawAttractionCN Tower3.4 km outside town, to the east · 1.5M visitors a year
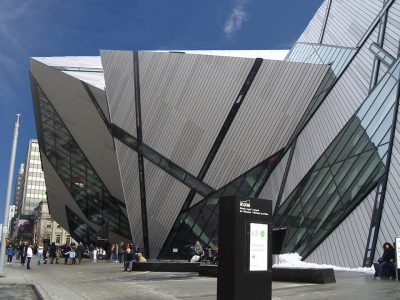 Big drawMuseumRoyal Ontario Museum4 km outside town, to the northeast · 281.4M visitors a year (2025)
 Big drawArt galleryArt Gallery of Ontario3.2 km outside town, to the northeast · 873K visitors a year (2016)
 Historic houseCasa Loma4.1 km outside town, to the northeast
 GardenHigh Park1.1 km outside town, to the west
Photos: each place’s Wikidata image, from Wikimedia Commons under the licence below (our copy, resized).
Photo credits (5)
- CN Tower: Chris Woodrich, CC BY-SA 4.0, Wikimedia Commons
- Royal Ontario Museum: Staka, CC BY-SA 4.0, Wikimedia Commons
- Art Gallery of Ontario: Owen Byrne from Ottawa, Canada, CC BY 2.0, Wikimedia Commons
- Casa Loma: Evelyncyuzu, CC BY-SA 4.0, Wikimedia Commons
- High Park: Chensiyuan at English Wikipedia, CC BY-SA 3.0, Wikimedia Commons
The data
Data highlights are ordered by what stands out in Roncesvalles.
Home ownership in Roncesvalles, 47%, runs below Ontario’s towns and Canadian towns
Measured across the Toronto metro area: rent as a share of income and monthly rent for a two-bedroom
Rent took 27% of household income, higher than both Ontario’s towns (22%) and Canadian towns (20%). Shelter took 30% or more of income for 30% of households, above both Ontario’s towns (22%) and Canadian towns (18%).
What homes were worth · The median owner’s estimate at the 2021 census
| Census 2021 | Roncesvalles | Ontario | Canada |
|---|---|---|---|
| Households owning their home | 47% | 76% | 74% |
| Households spending 30%+ on shelter | 30% | 22% | 18% |
| Rent as a share of income | 27% | 22% | 20% |
Statistics Canada, Census 2021; CMHC Rental Market Survey via Statistics Canada · These are 2021 census values, as owners judged them, set against household income in 2020.
Few places match Roncesvalles for health: it beats 91% of Canadian towns
Self-rated health is ordinary for Ontario: 50% of the region’s adults say very good or excellent, the province 51%. Statistics Canada puts life expectancy at 84.7, higher than both Ontario’s towns (82.8) and Canadian towns (81.5). Smoking is rarer than in the province: nearly one in ten adults, against 11% for Ontario. For Roncesvalles itself the measure is access, and it scores well: 0.8 km to the nearest hospital, where 3.7 km is typical. Nobody publishes health survey and life expectancy for Roncesvalles alone, so this card uses the figure for the City of Toronto Health Unit.
Very good or excellent health · adults, age-standardised
| Health | Roncesvalles | Ontario | Canada |
|---|---|---|---|
| Life expectancy at birth | 84.7 | 82.8 | 81.5 |
| Smokers | 9.2% | 10% | 12% |
| Chronic conditions (average share) | 16% | 17% | 17% |
| Very good or excellent health | 50% | 51% | 52% |
Statistics Canada, Canadian Community Health Survey 2023/2024 and life expectancy 2022/2024; Open Database of Healthcare Facilities
English or French, public or Catholic: Roncesvalles’s schools come under 4 boards
Of its 78 tested schools, 37 sit in the top two fifths in Ontario and 19 in the bottom two. The largest is Humberside Collegiate Institute, with 1,460 students. 7 of the 93 teach in French, against 10% of schools in Ontario. Within 3 km of Roncesvalles are 73 elementary schools, 19 secondary schools and 1 alternative or adult school, teaching 33,350 students.
| School | Level | Students | System |
|---|---|---|---|
| Runnymede Junior and Senior Public School Top fifth in OntarioLargest elementary schoolElementary · Grades JK–8 | Elementary · Grades JK–8 | 975 | English public |
| Humberside Collegiate Institute Top fifth in OntarioLargest secondary schoolSecondary · Grades 9–12 | Secondary · Grades 9–12 | 1,460 | English public |
| ÉSC Saint-Frère-André FrenchTeaches in FrenchSecondary · Grades 9–12 | Secondary · Grades 9–12 | 350 | French Catholic |
| Bloor Collegiate Institute Top fifth in OntarioResults in the top fifth in OntarioSecondary · Grades 9–12 | Secondary · Grades 9–12 | 820 | English public |
Schools by system · Schools within 3 km
| Schools within 3 km | Roncesvalles | Ontario | Canada |
|---|---|---|---|
| School boards | 4 | 4 | 3 |
Provincial school lists and results, 2024-25
Hazards in Roncesvalles are mild: low wildfire and earthquake risk, and 2.7% of area homes above the radon guideline
NRCan expects $0.043 of shaking damage a year per $1,000 of buildings in Roncesvalles, near the typical $0.030. No one has filed a flood map for Roncesvalles on the national inventory. For earthquake risk, the only official count covers all of the city of Toronto, Roncesvalles included.
Radon tests above the guideline · share of tested homes, 200 Bq/m³
| Hazards | Roncesvalles | Ontario | Canada |
|---|---|---|---|
| Radon tests above the guideline | 2.7% | 4% | 6.6% |
| Earthquake loss per $1,000 of buildings a year | $0.043 | $0.043 | $0.030 |
NRCan seismic risk model and burned areas, Health Canada radon survey, the Flood Hazard Map Inventory
Commuters in Roncesvalles travel further than in Ontario’s towns or Canadian towns, 33 min on average
How working residents got to work · census 2021
| Census 2021 | Roncesvalles | Ontario | Canada |
|---|---|---|---|
| Average trip | 33 min | 29 min | 26 min |
Statistics Canada, Census 2021 (labour and commuting) · These are May 2021 figures, gathered while COVID-19 kept many people home or out of work.
Roncesvalles has milder winters than Ontario’s towns or Canadian towns: January lows of −7.1°C
A normal January brings 32 cm of snow, the most of any month. The thermometer drops below freezing on 110 days a year, lower than both Ontario’s towns (139) and Canadian towns (159). Midsummer afternoons in Roncesvalles peak at about 25.3°C.
Average high by season · ECCC normals, 1991–2020
| Normals, 1991–2020 | Roncesvalles | Ontario | Canada |
|---|---|---|---|
| Days with frost a year | 110 | 139 | 159 |
| January night low | −7.1°C | −9.1°C | −13.5°C |
| July afternoon high | 25.3°C | 26.7°C | 25.5°C |
| Snowfall a year | 115 cm | 146 cm | 141 cm |
Environment and Climate Change Canada, Canadian Climate Normals 1991–2020 (Toronto (Island))
A younger town: only 13% of people in Roncesvalles are 65 or over, fewer than in Ontario’s towns and across Canadian towns
28% of residents belong to a visible minority, above both Ontario’s towns (26%) and Canadian towns (15%). Both official languages: 18% of residents, above both Ontario’s towns (6.7%) and Canadian towns (7.5%).
Ages · Share of residents in each age group, Census 2021
Schooling · Highest qualification, residents 15 and over
Women and men · all residents
Women make up 50.6% of Roncesvalles
By the 2021 count the town had 7,465 women and 7,285 men, while Canada has 50.9% women.
| Roncesvalles | Ontario | Canada | |
|---|---|---|---|
| Under 15 | 15% | 15% | 16% |
| 15 to 64 | 72% | 65% | 64% |
| 65+ | 13% | 19% | 19% |
| No certificate, diploma or degree | 14% | 15% | 16% |
| Postsecondary qualification | 67% | 56% | 56% |
Statistics Canada, Census 2021; Ontario and Canada: medians of towns of 2,500+
A normal November in Roncesvalles runs from 2°C to 8°C
For today and the week ahead, the Weather page carries ECCC’s Toronto Island forecast. Then December: 3°C by day, −3°C at night. About 9 cm of snow falls in a normal November. In November, the normal is 71 mm of rain and snow.
Normal highs, the months ahead · ECCC normals, 1991–2020
| Season | High | Low | Rain and snow |
|---|---|---|---|
| Winter | 1°C | −6°C | 176 mm |
| Spring | 10°C | 3°C | 207 mm |
| Summer | 24°C | 16°C | 230 mm |
| Autumn | 14°C | 7°C | 209 mm |
ECCC normals, 1991–2020 (Toronto (Island)); the forecast is on the Weather page
No public library stands in Roncesvalles: the closest, Toronto Public Library - High Park, is 0.6 km away
Toronto public library serves the whole of Toronto, so the library figures on this page are the city’s: 3,110,984 people, Roncesvalles among them.
Provincial library statistics, OpenStreetMap, the CRA and Statistics Canada
Roncesvalles’s grade for safety: a B−
For violence alone, its police area’s index was 93, above Ontario’s towns (76) and Canadian towns (86) alike. Where it is policed, thefts, break-ins and damage came to 34.4 per 1,000 a year, higher than both Ontario’s towns (30.5) and Canadian towns (31.2).
Year by year · Crime Severity Index for each year
| 2023–2025 | Roncesvalles | Ontario | Canada |
|---|---|---|---|
| Violent Crime Severity Index | 93 | 76 | 86 |
| Property crime per 1,000 | 34.4 | 30.5 | 31.2 |
Statistics Canada, Uniform Crime Reporting Survey, 2023–2025 average · Crime Severity Index, Violent Crime Severity Index, violent crime and property crime per 1,000: one figure for all of the Toronto service area
Roncesvalles is 27 km from Rouge National Urban Park
The closest provincial park is Bronte Creek Provincial Park, 36 km from the edge of town. E.T. Seton Park (130 ha) is the biggest, 9.2 km from town. Protected areas cover 1.3% of the land within 10 km; for the typical Canadian town it is 2.3%. Named trails close by number 4, the Garrison Creek Discovery Walk and Western Ravines & Beaches Discovery Walk 2 among them.
Protected land · of the land within 10 km
| Outdoors | Roncesvalles | Ontario | Canada |
|---|---|---|---|
| Protected land within 10 km | 1.3% | 2.3% | 2.3% |
| Public protected areas within 10 km | 4 | 4 | 4 |
Canadian Protected and Conserved Areas Database (CPCAD), OpenStreetMap routes and beaches
An older town: 67% of Roncesvalles’s homes predate 1961
| Heritage | Roncesvalles | Ontario | Canada |
|---|---|---|---|
| Homes built before 1961 | 67% | 22% | 18% |
Canadian Register of Historic Places, Directory of Federal Heritage Designations, Québec’s Répertoire du patrimoine culturel, Wikidata; Census 2021 homes by period
Everything we know about Roncesvalles
Roncesvalles’ neighbours
The nearest places of 1,000 or more. Statistics Canada
| Town | People | km | Overall | Cost | Safety | Health |
|---|---|---|---|---|---|---|
| Roncesvalles | 14,725 | — | B | D− | B− | A |
| Little Portugal | 15,669 | 1.2 | B | D− | B | A |
| Dufferin Grove | 11,276 | 1.2 | C+ | D− | C− | A |
| South Parkdale | 21,663 | 1.3 | B− | D− | B− | A |
| Junction-Wallace Emerson | 23,484 | 2 | B | D− | B− | A |
| Trinity-Bellwoods | 15,691 | 2.1 | B− | D− | C | A |
| High Park North | 22,162 | 2.1 | B+ | D− | B+ | A |
People: Statistics Canada, Census 2021. Distances: centre to centre.
About Roncesvalles
Neighbourhood in Toronto
No official boundary marks Roncesvalles off from the rest of Toronto: TownRatings draws it from the census’s dissemination areas and takes its name from the city’s map or OpenStreetMap.
Statistics Canada: population estimates 2025 (17-10-0155), Census of Population 2021, 2021 census boundaries.
- Population
- 14,725 (people, 2021 estimate)
- Province or territory
- Ontario
- City
- Toronto
- Census subdivision
- 3520005
Sources: Statistics Canada, Census of Population 2021 · population estimates 2025 (17-10-0155) and 2021 census boundaries · Uniform Crime Reporting Survey 2023–25 (35-10-0026, 35-10-0183 to 35-10-0190) · CMHC rents as published by Statistics Canada (34-10-0133) · grades by TownRatings. Under the Statistics Canada Open Licence.
Adapted from Statistics Canada (Census of Population 2021, population estimates 2025, 2021 census boundaries) under the Statistics Canada Open Licence; this does not constitute an endorsement by Statistics Canada. Neighbourhood names in some cities © OpenStreetMap contributors (ODbL).