
Kensington-ChinatownToronto
18,597 people call this neighbourhood in Toronto home. Toronto is split into 158 neighbourhoods, and this is one.
Is Kensington-Chinatown a good place to live?
Kensington-Chinatown’s grades pull in different directions. Prices are high against local incomes (D−). The neighbourhood grades C overall and ranks #704 of 858 in Ontario. Nationally, it does better than 28% of Canadian towns. It lags on safety as well (D). Health outcomes beat most towns (A). Add walkability to its strengths (A+). Jobs & income is weaker too (D).
Rents here are the metro area's average, shared by every town and neighbourhood in it. Safety uses the city's Crime Severity Index, scaled by this neighbourhood's own violent and property crime rates. Health is graded on the health region's survey figures and life expectancy, with the distance to hospital giving the town its own spread.
What makes Kensington-Chinatown stand out
The 3 things Kensington-Chinatown does most differently from other towns.
How Kensington-Chinatown grades
Each subject compares Kensington-Chinatown with Canadian towns of 2,500 or more, ordered by how far it is from the middle. Towns in other countries are graded separately.
How TownRatings grades Canadian towns →
Art Gallery of Ontario and 132 more in and around Kensington-Chinatown
A first look at Kensington-Chinatown’s museums, historic sites and days out, and a few just outside town.
 Big drawArt galleryArt Gallery of Ontarioin town · 873K visitors a year (2016)
 MuseumRoyal Canadian Military Institutein town
 Big drawAttractionCN Tower900 m outside town, to the southeast · 1.5M visitors a year
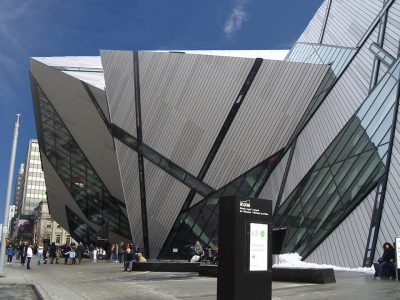 Big drawMuseumRoyal Ontario Museum1 km outside town, to the north · 281.4M visitors a year (2025)
 Historic houseCasa Loma2.4 km outside town, to the northwest
 MuseumBata Shoe Museum1 km outside town, to the northwest
Photos: each place’s Wikidata image, from Wikimedia Commons under the licence below (our copy, resized).
Photo credits (6)
- Art Gallery of Ontario: Owen Byrne from Ottawa, Canada, CC BY 2.0, Wikimedia Commons
- Royal Canadian Military Institute: SimonP, CC BY-SA 3.0, Wikimedia Commons
- CN Tower: Chris Woodrich, CC BY-SA 4.0, Wikimedia Commons
- Royal Ontario Museum: Staka, CC BY-SA 4.0, Wikimedia Commons
- Casa Loma: Evelyncyuzu, CC BY-SA 4.0, Wikimedia Commons
- Bata Shoe Museum: Gisling, CC BY-SA 3.0, Wikimedia Commons
The data
Data highlights are ordered by what stands out in Kensington-Chinatown.
Fewer households own their home in Kensington-Chinatown than in Ontario’s towns or across Canadian towns: 32%
Shared with the rest of the Toronto metro area: rent as a share of income and monthly rent for a two-bedroom
Rent took 40% of household income, above Ontario’s towns (22%) and Canadian towns (20%) alike. Shelter took 30% or more of income for 42% of households, above both Ontario’s towns (22%) and Canadian towns (18%).
What homes were worth · The median owner’s estimate at the 2021 census
| Census 2021 | Kensington-Chinatown | Ontario | Canada |
|---|---|---|---|
| Rent as a share of income | 40% | 22% | 20% |
| Households owning their home | 32% | 76% | 74% |
| Households spending 30%+ on shelter | 42% | 22% | 18% |
Statistics Canada, Census 2021; CMHC Rental Market Survey via Statistics Canada · Home values are owners’ own estimates at the May 2021 census, and incomes are for 2020.
Fewer of Kensington-Chinatown’s 15-to-64s are in work than in 93% of Canadian towns
The average trip to work took 27 min, lower than Ontario’s towns (29 min) and near Canadian towns (26 min).
How working residents got to work · census 2021
| Census 2021 | Kensington-Chinatown | Ontario | Canada |
|---|---|---|---|
| Average trip | 27 min | 29 min | 26 min |
Statistics Canada, Census 2021 (labour and commuting) · Census day was in May 2021, mid-pandemic, so commuting and work figures carry the lockdowns’ mark.
Kensington-Chinatown’s grade for safety: a D
The violent index for its police area came to 93, above Ontario’s towns (76) and Canadian towns (86) alike. Property crime in its police area ran at 34.4 per 1,000 residents a year, above Ontario’s towns (30.5) and Canadian towns (31.2) alike. Behind Crime Severity Index, Violent Crime Severity Index, violent crime and property crime per 1,000 sits data gathered across the Toronto service area, with Kensington-Chinatown one part of it.
Year by year · Crime Severity Index for each year
| 2023–2025 | Kensington-Chinatown | Ontario | Canada |
|---|---|---|---|
| Violent Crime Severity Index | 93 | 76 | 86 |
| Property crime per 1,000 | 34.4 | 30.5 | 31.2 |
Statistics Canada, Uniform Crime Reporting Survey, 2023–2025 average
Kensington-Chinatown scores better for health than nine in ten Canadian towns
The health survey and life expectancy numbers here cover the City of Toronto Health Unit
The three chronic conditions the survey tracks average 16% of adults, close to both Ontario’s towns (17%) and Canadian towns (17%). Women in the region live to 87.2 and men to 82.0, 84.7 years taken together (2022/2024). Across the region, half of adults say their health is very good or excellent, much as in Ontario (51%). The region has fewer smokers than Ontario, nearly one in ten adults to 11%.
Very good or excellent health · adults, age-standardised
| Health | Kensington-Chinatown | Ontario | Canada |
|---|---|---|---|
| Life expectancy at birth | 84.7 | 82.8 | 81.5 |
| Smokers | 9.2% | 10% | 12% |
| Chronic conditions (average share) | 16% | 17% | 17% |
| Very good or excellent health | 50% | 51% | 52% |
Statistics Canada, Canadian Community Health Survey 2023/2024 and life expectancy 2022/2024; Open Database of Healthcare Facilities
Kensington-Chinatown faces few natural hazards: little fire nearby, low seismic risk, radon over the guideline in 2.7% of tested homes
Shaking is about as much of a worry in Kensington-Chinatown as in most places, at $0.043 a year per $1,000 of building value ($0.030 typical). No one has filed a flood map for Kensington-Chinatown on the national inventory. Kensington-Chinatown doesn’t get its own earthquake risk figures; the ones here come from the city of Toronto.
Radon tests above the guideline · share of tested homes, 200 Bq/m³
| Hazards | Kensington-Chinatown | Ontario | Canada |
|---|---|---|---|
| Radon tests above the guideline | 2.7% | 4% | 6.6% |
| Earthquake loss per $1,000 of buildings a year | $0.043 | $0.043 | $0.030 |
NRCan seismic risk model and burned areas, Health Canada radon survey, the Flood Hazard Map Inventory
English or French, public or Catholic: Kensington-Chinatown’s schools come under 4 boards
9 of the 95 teach in French, against 10% of schools in Ontario. Results are mixed: 31 of 73 schools above the middle in Ontario, 23 below it.
| School | Level | Students | System |
|---|---|---|---|
| Dr. Rita Cox – Kina Minogok Public School Bottom fifth in OntarioLargest elementary schoolElementary · Grades JK–8 | Elementary · Grades JK–8 | 820 | English public |
| Central Technical School VocationalLargest secondary schoolSecondary · Grades 9–12 | Secondary · Grades 9–12 | 985 | English public |
| École élémentaire Pierre-Elliott-Trudeau FrenchTeaches in FrenchElementary · Grades JK–6 | Elementary · Grades JK–6 | 380 | French public |
| Bloor Collegiate Institute Top fifth in OntarioResults in the top fifth in OntarioSecondary · Grades 9–12 | Secondary · Grades 9–12 | 820 | English public |
Schools by system · Schools within 3 km
| Schools within 3 km | Kensington-Chinatown | Ontario | Canada |
|---|---|---|---|
| School boards | 4 | 4 | 3 |
Provincial school lists and results, 2024-25
Kensington-Chinatown has milder winters than Ontario’s towns or Canadian towns: January lows of −6.7°C
The warmest afternoons come in July, at around 27.0°C in Kensington-Chinatown. There are 101 days of frost in a typical year, below Ontario’s towns (139) and Canadian towns (159) alike. Frost usually lifts by 11 April and returns around 6 November: 208 days without it. A normal June brings 82 mm of precipitation, more than any other month.
Average high by season · ECCC normals, 1991–2020
| Normals, 1991–2020 | Kensington-Chinatown | Ontario | Canada |
|---|---|---|---|
| Days with frost a year | 101 | 139 | 159 |
| January night low | −6.7°C | −9.1°C | −13.5°C |
| July afternoon high | 27.0°C | 26.7°C | 25.5°C |
| Snowfall a year | 115 cm | 146 cm | 141 cm |
Environment and Climate Change Canada, Canadian Climate Normals 1991–2020 (Toronto (City))
Children make up only 6.8% of Kensington-Chinatown, fewer than in Ontario’s towns and across Canadian towns
63% of residents belong to a visible minority, above Ontario’s towns (26%) and Canadian towns (15%) alike. The 65-and-over age group makes up 16% of residents.
Ages · Share of residents in each age group, Census 2021
Schooling · Highest qualification, residents 15 and over
Women and men · all residents
Women make up 50.7% of Kensington-Chinatown
Here the census found 9,165 men and 9,420 women; the figure for women across Canada is 50.9%.
| Kensington-Chinatown | Ontario | Canada | |
|---|---|---|---|
| Under 15 | 6.8% | 15% | 16% |
| 15 to 64 | 77% | 65% | 64% |
| 65+ | 16% | 19% | 19% |
| No certificate, diploma or degree | 15% | 15% | 16% |
| Postsecondary qualification | 62% | 56% | 56% |
Statistics Canada, Census 2021; Ontario and Canada: medians of towns of 2,500+
In Kensington-Chinatown, November normally means 8°C afternoons and 2°C nights
Hour-by-hour figures come from ECCC’s Toronto forecast, on the Weather page. November normally sees 71 mm of precipitation. Into December, the normals move to 3°C and −3°C. About 9 cm of snow falls in a normal November.
Normal highs, the months ahead · ECCC normals, 1991–2020
| Season | High | Low | Rain and snow |
|---|---|---|---|
| Winter | 1°C | −5°C | 176 mm |
| Spring | 12°C | 4°C | 207 mm |
| Summer | 26°C | 17°C | 230 mm |
| Autumn | 15°C | 8°C | 209 mm |
ECCC normals, 1991–2020 (Toronto (City)); the forecast is on the Weather page
3 public library branches serve Kensington-Chinatown
Kensington-Chinatown is served by Toronto Public Library, the library of all of Toronto, so the figures here are the city’s, for 3,110,984 people.
Provincial library statistics, OpenStreetMap, the CRA and Statistics Canada
Within 24 km of Kensington-Chinatown: Rouge National Urban Park
For a provincial park, Bronte Creek Provincial Park lies 39 km off. E.T. Seton Park (130 ha) is the biggest, 5.7 km from town. 29 beaches are mapped within 5 km, the nearest HTO Beach. OpenStreetMap shows 8 walking routes nearby, including the PATH and Uptown Toronto Discovery Walk.
Protected land · of the land within 10 km
| Outdoors | Kensington-Chinatown | Ontario | Canada |
|---|---|---|---|
| Public protected areas within 10 km | 5 | 4 | 4 |
| Protected land within 10 km | 2.2% | 2.3% | 2.3% |
Canadian Protected and Conserved Areas Database (CPCAD), OpenStreetMap routes and beaches
Kensington-Chinatown: 3 historic places, every one with the highest designation
Just over a quarter of its homes were built before 1961, above Ontario’s towns (22%) and Canadian towns (18%) alike. Kensington Market, begun in 1815, is the oldest by its record.
Historic places by designation · inside the town
Among them
- Kensington Market 1815
- The Grange 1817
- George Brown House 1875
| Heritage | Kensington-Chinatown | Ontario | Canada |
|---|---|---|---|
| Homes built before 1961 | 26% | 22% | 18% |
Canadian Register of Historic Places, Directory of Federal Heritage Designations, Québec’s Répertoire du patrimoine culturel, Wikidata; Census 2021 homes by period
Everything we know about Kensington-Chinatown
Kensington-Chinatown’s neighbours
The nearest places of 1,000 or more. Statistics Canada
| Town | People | km | Overall | Cost | Safety | Health |
|---|---|---|---|---|---|---|
| Kensington-Chinatown | 18,597 | — | C | D− | D | A |
| Wellington Place | 25,729 | 0.7 | B | D− | C | A |
| Yonge-Bay Corridor | 12,888 | 1.1 | C | D− | D | A |
| University | 7,595 | 1.3 | C | D− | D | A |
| Harbourfront-CityPlace | 28,199 | 1.5 | B+ | D− | B | A |
| Bay-Cloverhill | 17,591 | 1.6 | B− | D− | B | A |
| Downtown Yonge East | 18,251 | 1.6 | C | D− | D | A |
People: Statistics Canada, Census 2021. Distances: centre to centre.
About Kensington-Chinatown
Neighbourhood in Toronto
Where Kensington-Chinatown begins and ends inside Toronto is TownRatings’s line, traced along census dissemination areas and named after the city’s map or OpenStreetMap.
Statistics Canada: population estimates 2025 (17-10-0155), Census of Population 2021, 2021 census boundaries.
- Population
- 18,597 (people, 2021 estimate)
- Province or territory
- Ontario
- City
- Toronto
- Census subdivision
- 3520005
Sources: Statistics Canada, Census of Population 2021 · population estimates 2025 (17-10-0155) and 2021 census boundaries · Uniform Crime Reporting Survey 2023–25 (35-10-0026, 35-10-0183 to 35-10-0190) · CMHC rents as published by Statistics Canada (34-10-0133) · grades by TownRatings. Under the Statistics Canada Open Licence.
Adapted from Statistics Canada (Census of Population 2021, population estimates 2025, 2021 census boundaries) under the Statistics Canada Open Licence; this does not constitute an endorsement by Statistics Canada. Neighbourhood names in some cities © OpenStreetMap contributors (ODbL).