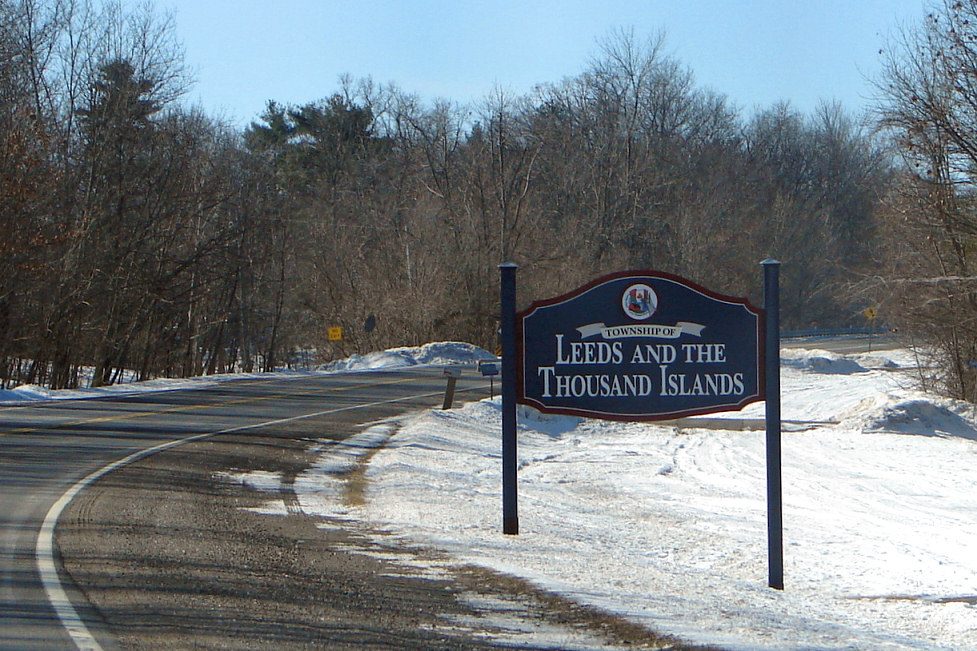
 Photo: P199 · Public domain
Frosty mornings in Leeds and the Thousand Islands are scarcer than in 72% of Canadian towns
Sunny July days climb to about 26.1°C. Rain and snow together come to more here than on 69% of Canadian towns. Expect the most rain and snow in July and the least in February. Garden chairs stay out from May to September, the months with highs of 19–26°C.
These are not Leeds and the Thousand Islands’s own readings: ECCC keeps no normals there, so the page uses Brockville, 36 km north-east.
A year in Leeds and the Thousand Islands at a glance
Each month’s typical high and low, in °C.
What stands out about Leeds and the Thousand Islands’s climate
Compared with Canadian towns, with its place among towns of 2,500+ in Ontario beside it.
What a year in Leeds and the Thousand Islands feels like
Seasons and months as ECCC’s 1991–2020 normals give them: a typical day’s high and low.
Frost on 140 days, 20°C on 118
The frost season runs October to April, and January freezes nearly every night. Some 8 nights a year drop under −20°C.
Frost days by month
Average days at 0°C or below
Days above 20°C by month
Average days
About 1,017 mm of rain and snow a year
About 129 days a year bring 1 mm or more.
Rain and snow by month
Millimetres
Rain alone by month
Millimetres
180 cm of snow in a typical year
Expect snow from October to April, with about 50 cm in January, the snowiest month.
Snowfall by month
Centimetres
Snow on the ground by month
Centimetres at month’s end
Heating a home in Leeds and the Thousand Islands
93% of a year’s heating need falls between October and April. Months averaging under 10°C: October to April.
Warm days count for nothing; each colder day adds how far its mean sits below 18°C. That means homes here need less heating than 70% of Canadian towns.
Living with Leeds and the Thousand Islands’s climate
What the normals mean for a garden, a day outside and the depth of winter.
Tender plants are usually safe from around 27 April until frost returns near 14 October: about 169 days.
Afternoons of 17–27°C and nights of at least 8°C arrive in May, Jun, Jul, Aug and Sep.
Parks & trails →Storms, floods and heat waves sit outside these normals; Leeds and the Thousand Islands’s hazards page covers them.
Flood & hazards →ECCC’s normals location: Brockville
Brockville is a composite: ECCC joins 2 stations’ readings to make its 1991–2020 normals.
| Distance from the town | 36 km north-east |
| Station altitude | 120 m |
| Completeness | meets the WMO “3 and 5” rule |
| WMO standard normals | Yes |
| Coldest reading, 1991–2020 | −31.5°C |
| Hottest reading, 1991–2020 | 35.0°C |
| Next-nearest location | Kingston, 48 km |
How Leeds and the Thousand Islands compares
Against the 2,611 Canadian towns and neighbourhoods of 2,500 or more, each read from its own normals location; the dots are the other locations those towns use in Ontario.
Nearby towns’ climate
Nearby places read from a different ECCC location (places on Leeds and the Thousand Islands’s own would show the same figures). No closer place has figures: this one lies 12 km from Leeds and the Thousand Islands.
| Town | July high | January low | Rain & snow |
|---|---|---|---|
| Leeds and the Thousand Islands Brockville | 26.1°C | −11.3°C | 1,017 mm |
| Gananoque 12 km · Kingston | 25.4°C 0.7°C cooler | −11.5°C about the same | 1,017 mm |
Leeds and the Thousand Islands weather by month
Month by month, 1991–2020: the usual high, low and mean, the rain and snow, and the snowfall.
| Month | High | Low | Mean | Rain & snow | Snow |
|---|---|---|---|---|---|
| January | −3.1°C | −11.3°C | −7.2°C | 84 mm | 50 cm |
| February | −1.7°C | −10.3°C | −6.0°C | 64 mm | 41 cm |
| March | 3.7°C | −5.0°C | −0.7°C | 68 mm | 29 cm |
| April | 11.3°C | 1.8°C | 6.6°C | 89 mm | 8 cm |
| May | 18.8°C | 8.3°C | 13.5°C | 80 mm | under 1 cm |
| June | 23.4°C | 13.5°C | 18.5°C | 96 mm | 0 cm |
| July | 26.1°C | 16.5°C | 21.3°C | 99 mm | 0 cm |
| August | 25.4°C | 15.7°C | 20.6°C | 82 mm | 0 cm |
| September | 21.2°C | 11.7°C | 16.5°C | 96 mm | 0 cm |
| October | 13.8°C | 5.8°C | 9.7°C | 94 mm | 1 cm |
| November | 7.0°C | −0.2°C | 3.5°C | 81 mm | 11 cm |
| December | 0.4°C | −6.5°C | −3.0°C | 85 mm | 41 cm |
| Year | 12.2°C | 3.3°C | 7.8°C | 1,017 mm | 180 cm |
A January here can run warm or cold, its average moving by about 3.1°C; the steadiest month is June
Bars run from each month’s record low to its record high since 1991. March spans the most, from −26.0°C (2003) to 26.0°C (1998).
Where Leeds and the Thousand Islands’s numbers come from
Averages over 30 years, not a forecast.
- Normals: ECCC’s 1991–2020 Canadian Climate Normals for Brockville, the nearest location with a full year of temperatures.
- Comparisons: the 2,500-plus towns and neighbourhoods of Canada, each read from its closest normals location; whole cities and reserves aren’t counted.
- Not on this page: a sunshine figure (ECCC published none for 1991–2020) and any lapse-rate correction for height, as the town has no elevation here.
Canadian Climate Normals 1991–2020 · ECCC Data Services End-use Licence. Data Source: Environment and Climate Change Canada
Questions about Leeds and the Thousand Islands’s climate
How warm does Leeds and the Thousand Islands get in summer?
A normal July afternoon tops out at about 26.1°C, the year’s high point.
How cold does Leeds and the Thousand Islands get in winter?
January nights average −11.3°C, the coldest of the year.
How much rain and snow does Leeds and the Thousand Islands get?
Around 1,017 mm a year in all, from 99 mm in July down to 64 mm in February.
Are these figures for Leeds and the Thousand Islands itself?
Only indirectly: the readings are made at Brockville, outside Leeds and the Thousand Islands.
Data Source: Environment and Climate Change Canada · ECCC Data Services End-use Licence Today’s forecast for Leeds and the Thousand Islands →
Adapted from Statistics Canada (Census of Population 2021, population estimates 2025, 2021 census boundaries) under the Statistics Canada Open Licence; this does not constitute an endorsement by Statistics Canada. Neighbourhood names in some cities © OpenStreetMap contributors (ODbL).