
Liverpoolin Queens, Nova Scotia
The town has 10,997 residents and lies in Nova Scotia. It is part of Queens, a census division.
Is Liverpool a good place to live?
Health outcomes fall short of most towns (D). Incomes are on the low side (D). Floods and other hazards weigh less here (A−). Put together, the subjects come to a D− overall, ranking #85 of 88 in Nova Scotia. Set against the rest, it does better than 3% of Canadian towns.
Safety is the police detachment's figure, shared with the towns and countryside around it. No School Grade: this province doesn't publish comparable results school by school. Health is graded on the health region's survey figures and life expectancy, with the distance to hospital giving the town its own spread.
How Liverpool grades
Each subject compares Liverpool with Canadian towns of 2,500 or more, ordered by how far it is from the middle. Towns in other countries are graded separately.
How TownRatings grades Canadian towns →
What makes Liverpool stand out
The 3 things Liverpool does most differently from other towns.
The data
Data highlights are ordered by what stands out in Liverpool.
Household incomes in Liverpool trail those of 93% of Canadian towns
The commute to work averages 23 min. The car took 92% of commuters, about level with Nova Scotia’s towns (92%) and above Canadian towns (89%).
How working residents got to work · census 2021
| Census 2021 | Liverpool | Nova Scotia | Canada |
|---|---|---|---|
| Average trip | 23 min | 23 min | 26 min |
| Car or van | 92% | 92% | 89% |
Statistics Canada, Census 2021 (labour and commuting) · These are May 2021 figures, gathered while COVID-19 kept many people home or out of work.
The boundary of Kejimkujik National Park and National Historic Site runs along Liverpool
5 mapped walking routes pass within 2 km, among them the Port Joli Head Trail and Grafton Woods Trail. Parks and reserves take up 24% of the ground within 10 km, above Nova Scotia’s towns (8.7%) and Canadian towns (2.3%) alike; what’s more, 230 areas within 10 km are protected for nature. Some protected land is inside the town: just over a fifth of its area.
Protected land · of the land within 10 km
| Outdoors | Liverpool | Nova Scotia | Canada |
|---|---|---|---|
| Protected land within 10 km | 24% | 8.7% | 2.3% |
| Public protected areas within 10 km | 148 | 23.5 | 4 |
Canadian Protected and Conserved Areas Database (CPCAD), OpenStreetMap routes and beaches
For health, Liverpool sits behind 90% of Canadian towns
On average 20% of adults live with arthritis, diabetes or high blood pressure, about level with Nova Scotia’s towns (20%) and above Canadian towns (17%). The survey puts the region’s share in very good or excellent health at 44%, behind the 48% for Nova Scotia. At 19%, the share of adults who smoke tops the 14% for Nova Scotia. Life expectancy in the region is 80.0 years (82.5 for women, 77.6 for men, 2022/2024).
Very good or excellent health · adults, age-standardised
| Health | Liverpool | Nova Scotia | Canada |
|---|---|---|---|
| Smokers | 19% | 15% | 12% |
| Very good or excellent health | 44% | 49% | 52% |
| Chronic conditions (average share) | 20% | 20% | 17% |
| Life expectancy at birth | 80.0 | 80.0 | 81.5 |
Statistics Canada, Canadian Community Health Survey 2023/2024 and life expectancy 2022/2024; Open Database of Healthcare Facilities · Area behind the health survey and life expectancy figures: the Zone 1 - Western
Hazards in Liverpool: wildfire low, radon over the guideline in 6.2% of tested homes
Area-wide: radon tests, counted over the Zone 1 health region
Wildfire is rare near Liverpool: 0.1% of the land within 25 km has burned since 1986, a burn rate of 0.004% a year. Flood mapping: none on the national inventory of the town.
Radon tests above the guideline · share of tested homes, 200 Bq/m³
| Hazards | Liverpool | Nova Scotia | Canada |
|---|---|---|---|
| Radon tests above the guideline | 6.2% | 13% | 6.6% |
| Earthquake loss per $1,000 of buildings a year | $0.024 | $0.018 | $0.030 |
NRCan seismic risk model and burned areas, Health Canada radon survey, the Flood Hazard Map Inventory
Liverpool has cooler summers than Nova Scotia’s towns or Canadian towns: July highs of 19.9°C
Counting rain and snow alike, 1,561 mm falls in a year, above Nova Scotia’s towns (1,393 mm) and Canadian towns (883 mm) alike. On a January night, the temperature in Liverpool falls to about −7.2°C. Most of the snow comes in January, about 50 cm. For the wettest month, look to December: 163 mm on average.
Average high by season · ECCC normals, 1991–2020
| Normals, 1991–2020 | Liverpool | Nova Scotia | Canada |
|---|---|---|---|
| July afternoon high | 19.9°C | 23.1°C | 25.5°C |
| Precipitation a year | 1,561 mm | 1,393 mm | 883 mm |
| January night low | −7.2°C | −8.9°C | −13.5°C |
| Days with frost a year | 127 | 133 | 159 |
Environment and Climate Change Canada, Canadian Climate Normals 1991–2020 (Western Head)
Rent takes more of local pay in Liverpool than in Nova Scotia’s towns or Canadian towns: 24% of household income
14% of households spent 30% or more of their income on shelter, above Nova Scotia’s towns (13%) but below Canadian towns (18%). Owners make up 82% of households.
What homes were worth · The median owner’s estimate at the 2021 census
| Census 2021 | Liverpool | Nova Scotia | Canada |
|---|---|---|---|
| Rent as a share of income | 24% | 21% | 20% |
| Households spending 30%+ on shelter | 14% | 13% | 18% |
| Households owning their home | 82% | 82% | 74% |
Statistics Canada, Census 2021; CMHC Rental Market Survey via Statistics Canada · These are 2021 census values, as owners judged them, set against household income in 2020.
Liverpool is graded a C+ for safety
Where it is policed, 18.5 violent incidents per 1,000 residents are recorded each year. The violent index for its police area came to 113, above both Nova Scotia’s towns (94) and Canadian towns (86). Its police area records 27.8 property incidents per 1,000 residents a year. Figures for Crime Severity Index, Violent Crime Severity Index, violent crime and property crime per 1,000 are published for the Queens County detachment area as a whole, not for Liverpool alone.
Year by year · Crime Severity Index for each year
| 2023–2025 | Liverpool | Nova Scotia | Canada |
|---|---|---|---|
| Violent crime | 18.5 | 14.5 | 12 |
| Violent Crime Severity Index | 113 | 94 | 86 |
| Property crime per 1,000 | 27.8 | 36.2 | 31.2 |
| Crime Severity Index | 78 | 71 | 67 |
Statistics Canada, Uniform Crime Reporting Survey, 2023–2025 average
More of Liverpool’s residents have an Indigenous identity than in Nova Scotia’s towns or Canadian towns: 9.9%
2.4% of residents belong to a visible minority, below both Nova Scotia’s towns (4%) and Canadian towns (15%). Immigrants make up 4.7% of residents, higher than Nova Scotia’s towns (4.3%) yet lower than Canadian towns (6.4%).
Ages · Share of residents in each age group, Census 2021
Schooling · Highest qualification, residents 15 and over
Women and men · all residents
Women make up 50.7% of Liverpool
The 2021 census counted 5,285 women and 5,135 men here, where women make up 50.9% of Canada.
| Liverpool | Nova Scotia | Canada | |
|---|---|---|---|
| Under 15 | 11% | 14% | 16% |
| 15 to 64 | 58% | 62% | 64% |
| 65+ | 32% | 25% | 19% |
| No certificate, diploma or degree | 25% | 18% | 16% |
| Postsecondary qualification | 46% | 54% | 56% |
Statistics Canada, Census 2021; Nova Scotia and Canada: medians of towns of 2,500+
A normal November in Liverpool runs from 1°C to 9°C
December follows at 5°C by day and −4°C by night. Snowfall in a normal November: 10 cm. Rain and snow over a typical November come to 160 mm. August brings the warmest days, 21°C; January the coldest nights, −7°C.
Normal highs, the months ahead · ECCC normals, 1991–2020
| Season | High | Low | Rain and snow |
|---|---|---|---|
| Winter | 3°C | −6°C | 413 mm |
| Spring | 9°C | 1°C | 402 mm |
| Summer | 19°C | 11°C | 299 mm |
| Autumn | 14°C | 6°C | 447 mm |
ECCC normals, 1991–2020 (Western Head); the forecast is on the Weather page
Liverpool’s MP is Jessica Fancy-Landry (Liberal Party of Canada), for South Shore—St. Margarets
Liverpool has no council of its own: it belongs to Queens, a regional municipality.
Wikidata, MAMH, MMAH, Statistics Canada
Alean Freeman Library and Thomas H Randall Library are Liverpool’s two public libraries
Without open library statistics in Nova Scotia, the page names Liverpool’s libraries but shows no visits or loans.
Provincial library statistics, OpenStreetMap, the CRA and Statistics Canada
6 schools serve Liverpool, 4 elementary schools and 2 secondary schools
The closest elementary school is 5.1 km away, higher than both Nova Scotia’s towns (1.9 km) and Canadian towns (0.5 km). The nearest secondary school is 3.8 km away, below Nova Scotia’s towns (4.3 km) but above Canadian towns (1.2 km).
| School | Level | Students | System |
|---|---|---|---|
| Dr. John C. Wickwire AcademyIn LiverpoolElementary | Elementary | – | English public |
| Liverpool Regional High SchoolIn LiverpoolSecondary · Grades 9–RG | Secondary · Grades 9–RG | – | English public |
| Schools within 3 km | Liverpool | Nova Scotia | Canada |
|---|---|---|---|
| Nearest elementary school | 5.1 km | 1.9 km | 0.5 km |
| Nearest secondary school | 3.8 km | 4.3 km | 1.2 km |
Provincial school lists and results, 2025-26 · In Nova Scotia, no schools grade. The province reports its assessments by regional centre, and that series stops in 2019–20.
Liverpool keeps its older homes: 44% from before 1961
3 more stand just outside, within 5 km of the town’s edge. Inside the town there is 1 historic place, a top designation.
Historic places by designation · inside the town
Among them
- Liverpool Town Hall 1901
| Heritage | Liverpool | Nova Scotia | Canada |
|---|---|---|---|
| Homes built before 1961 | 44% | 28% | 18% |
Canadian Register of Historic Places, Directory of Federal Heritage Designations, Québec’s Répertoire du patrimoine culturel, Wikidata; Census 2021 homes by period
Everything we know about Liverpool
Hank Snow Home Town Museum and 5 more in and around Liverpool
A first look at Liverpool’s museums, historic sites and days out, and a few just outside town.
 MuseumHank Snow Home Town Museumin town
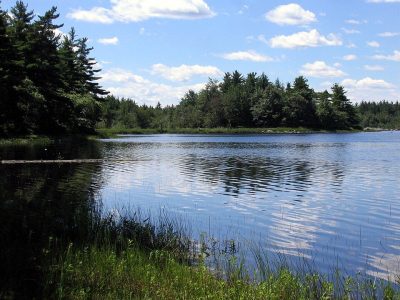 National park · Parks CanadaKejimkujik2.9 km outside town, to the west
 MuseumPerkins House100 m outside town, to the east
Photos: each place’s Wikidata image, from Wikimedia Commons under the licence below (our copy, resized).
Photo credits (3)
- Hank Snow Home Town Museum: Dennis G. Jarvis, CC BY-SA 2.0, Wikimedia Commons
- Kejimkujik: Aconcagua, CC BY-SA 3.0, Wikimedia Commons
- Perkins House: Verne Equinox, CC BY 3.0, Wikimedia Commons
Famous people from Liverpool
33 notable people were born in Liverpool.


Photo credits
Hank Snow: RCA Records, Public domain · Bruce Palmer: Atlantic Records, Public domain · Margaret Marshall Saunders: Anonymous, Public domain · Jessie G. Garnett: Copied from a book in the public domain: Hayden, Robert C. (1992). African-Americans in Boston: More than 350 Years. Trustees of the Boston Public Library. p. 145. ISBN 0-89073-083-0 ., Public domain
About Liverpool
Town in Nova Scotia
Liverpool is a municipality in Nova Scotia, read by TownRatings as Statistics Canada draws it: one census subdivision, so its figures cover the whole municipality.
Statistics Canada: population estimates 2025 (17-10-0155), Census of Population 2021, 2021 census boundaries.
- Population
- 10,997 (people, 2025 estimate)
- Province or territory
- Nova Scotia
- Census division
- Queens
- Census subdivision
- 1204010
Questions about Liverpool
Who are the people of Liverpool?
At the 2021 census, 5% were immigrants and 2% belonged to a visible minority (Canadian towns’ median: 15%). 10% identify as First Nations, Métis or Inuit.
What kind of homes are in Liverpool?
Mostly 87% single-detached houses (the median of Canadian towns: 64%), with 0% of homes in buildings of five or more storeys. Households hold 2.1 people on average, and 33% have just one.
How old are the people of Liverpool?
At 55.6, its median age compares with 45.2 across Canadian towns. Children make up 11% of the population and seniors 32%.
Is Liverpool growing?
It grew from 10,302 people in 2016 to 10,422 in 2021, up 1.2%; the median of Canadian towns grew 4.1%. StatCan’s 2025 estimate is 10,997.
Sources: Statistics Canada, Census of Population 2021 · population estimates 2025 (17-10-0155) and 2021 census boundaries · Uniform Crime Reporting Survey 2023–25 (35-10-0026, 35-10-0183 to 35-10-0190) · CMHC rents as published by Statistics Canada (34-10-0133) · grades by TownRatings. Under the Statistics Canada Open Licence.
Adapted from Statistics Canada (Census of Population 2021, population estimates 2025, 2021 census boundaries) under the Statistics Canada Open Licence; this does not constitute an endorsement by Statistics Canada. Neighbourhood names in some cities © OpenStreetMap contributors (ODbL).