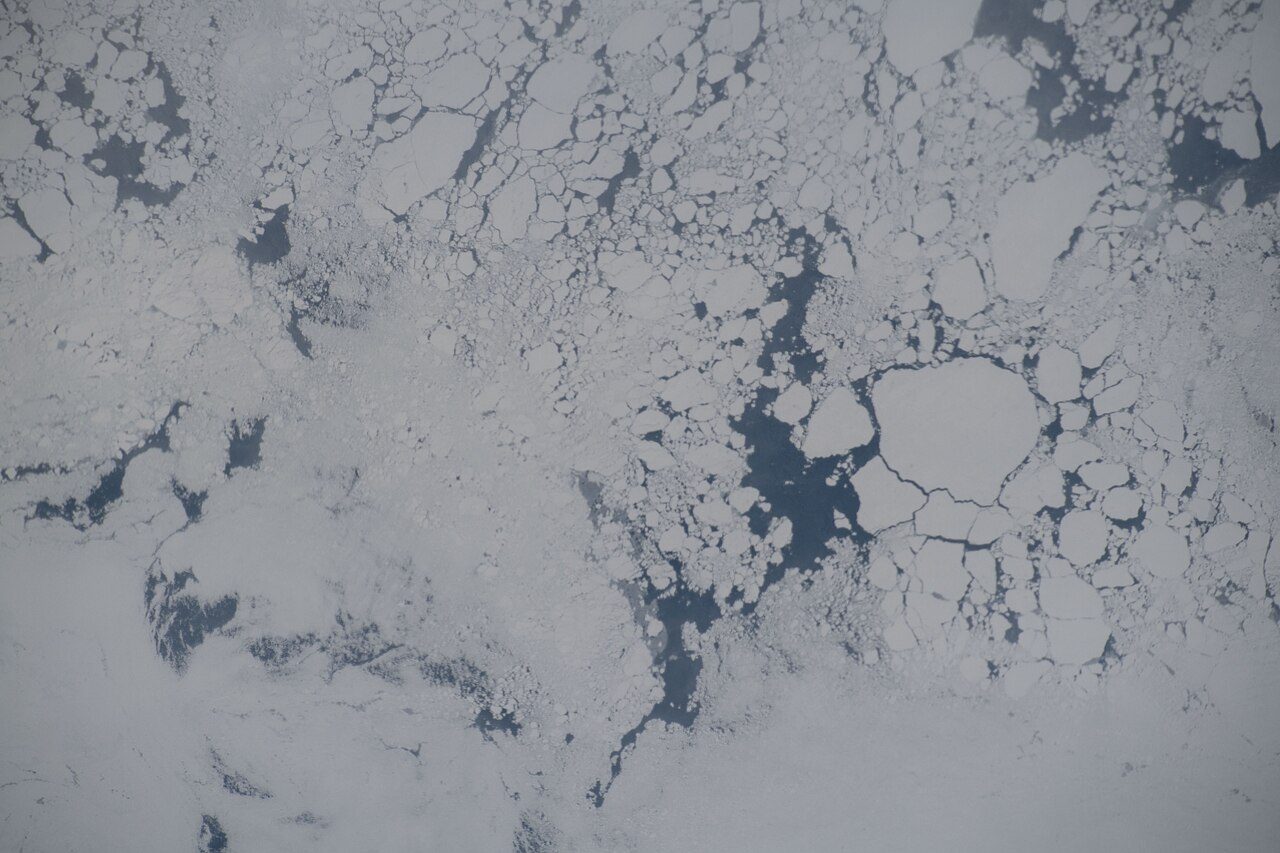
 Photo: Earth Science and Remote Sensing Unit, NASA Johnson Space Center · Public domain
Hardly any Canadian towns see fresher July days than Division No. 8, Subdivision L
Nights in January average −7.7°C. Seasons differ by 29°C, from the coldest nights to the warmest afternoons. Precipitation is plentiful here, more than falls on 92% of Canadian towns. Plan for rain or snow on about 162 days a year, the days with 1 mm or more.
No ECCC station in Division No. 8, Subdivision L has 1991–2020 normals; the page reads Twillingate, 45 km north-west, instead.
A year in Division No. 8, Subdivision L at a glance
Each month’s typical high and low, in °C.
What stands out about Division No. 8, Subdivision L’s climate
Compared with Canadian towns, with its place among towns of 2,500+ in Newfoundland and Labrador beside it.
What a year in Division No. 8, Subdivision L feels like
Seasons and months as ECCC’s 1991–2020 normals give them: a typical day’s high and low.
Frost on 169 days, 20°C on 47
From October to May frost is routine, and in January it comes on almost every night.
Frost days by month
Average days at 0°C or below
Days above 20°C by month
Average days
1,247 mm of precipitation in a typical year
The most falls in December, the least in June.
Rain and snow by month
Millimetres
Rain alone by month
Millimetres
Twillingate publishes no full year of precipitation or snowfall, so these figures, and the snow below, come from Gander, 46 km away.
About 443 cm of snow a year
The snow season runs October to June; January brings the most, about 97 cm. 2nd snowiest of 31 towns of 2,500+ in Newfoundland and Labrador.
Snowfall by month
Centimetres
Heating a home in Division No. 8, Subdivision L
80% of a year’s heating need falls between October and April. Months averaging under 10°C: October to May.
The total grows by a degree for every degree a day’s mean sits under 18°C. That means homes here need more heating than 62% of Canadian towns.
Living with Division No. 8, Subdivision L’s climate
Gardening, time outside, winter cold and summer heat, from the 1991–2020 normals.
Highs of 17–27°C with nights of 8°C or more come in Jul and Aug.
Parks & trails →The wind chill passes −20 on about 30 days in a normal year.
About 6 days a year turn sultry, with the humidex past 30.
For the weather that does damage, from ice storms to floods, see Division No. 8, Subdivision L’s hazards page.
Flood & hazards →ECCC’s normals location: Twillingate
The page’s figures are ECCC’s 1991–2020 normals for Twillingate, one of its 450 normals locations.
| Distance from the town | 45 km north-west |
| Station altitude | 92 m |
| Completeness | at least 20 years |
| WMO standard normals | No |
| Precipitation from | Gander, 46 km |
| Coldest reading, 1991–2020 | −22.6°C |
| Hottest reading, 1991–2020 | 31.7°C |
| Average wind | 25.0 km/h on average, most often from the south-west |
| Next-nearest location | Gander, 46 km |
How Division No. 8, Subdivision L compares
Placed among 2,611 Canadian towns and neighbourhoods of 2,500+, each on its nearest normals location; each dot is another location used in Newfoundland and Labrador.
Nearby towns’ climate
The nearest places on a normals location of their own: those that share Division No. 8, Subdivision L’s would only repeat its figures. The nearest places to Division No. 8, Subdivision L with figures are 46–67 km away.
| Town | July high | January low | Rain & snow |
|---|---|---|---|
| Division No. 8, Subdivision L Twillingate | 19.9°C | −7.7°C | 1,247 mm |
| Gander 46 km · Gander | 21.8°C 1.9°C warmer | −10.4°C 2.7°C colder | 1,247 mm |
| New-Wes-Valley 65 km · Bonavista | 19.7°C about the same | −7.0°C 0.7°C milder | 1,247 mm |
Division No. 8, Subdivision L weather by month
Each month’s normals, 1991–2020: high, low, mean, precipitation and snowfall.
| Month | High | Low | Mean | Rain & snow | Snow |
|---|---|---|---|---|---|
| January | −2.3°C | −7.7°C | −5.0°C | 103 mm | 97 cm |
| February | −2.8°C | −8.7°C | −5.8°C | 91 mm | 81 cm |
| March | −0.6°C | −6.3°C | −3.5°C | 105 mm | 86 cm |
| April | 3.9°C | −2.1°C | 1.0°C | 92 mm | 46 cm |
| May | 8.7°C | 1.5°C | 5.3°C | 94 mm | 11 cm |
| June | 14.3°C | 6.1°C | 10.2°C | 89 mm | 2 cm |
| July | 19.9°C | 11.5°C | 15.8°C | 105 mm | 0 cm |
| August | 19.5°C | 12.4°C | 16.0°C | 102 mm | 0 cm |
| September | 15.5°C | 9.0°C | 12.2°C | 115 mm | under 1 cm |
| October | 9.3°C | 4.4°C | 6.9°C | 120 mm | 12 cm |
| November | 4.7°C | 0.0°C | 2.4°C | 110 mm | 30 cm |
| December | 0.2°C | −4.3°C | −2.1°C | 121 mm | 80 cm |
| Year | 7.5°C | 1.3°C | 4.5°C | 1,247 mm | 443 cm |
The most changeable month: February, give or take 1.9°C; the steadiest, November
Records from 1991 to 2020: no month spans more than February, between −22.6°C (1993) and 12.9°C (1996).
Where Division No. 8, Subdivision L’s numbers come from
Averages over 30 years, not a forecast.
- Normals: the 1991–2020 Canadian Climate Normals at Twillingate, the closest ECCC location with twelve months of temperature normals.
- Other locations: a location missing months of precipitation or snow is filled from the nearest that has them all, never mixed month by month.
- Comparisons: Canada’s towns and neighbourhoods of 2,500+ (no city totals, no reserves), each through its own nearest location.
- Not on this page: a sunshine figure (ECCC published none for 1991–2020) and any lapse-rate correction for height, as the town has no elevation here.
Canadian Climate Normals 1991–2020 · ECCC Data Services End-use Licence. Data Source: Environment and Climate Change Canada
Questions about Division No. 8, Subdivision L’s climate
How warm does Division No. 8, Subdivision L get in summer?
Highs reach 19.9°C on an average July day; no month is warmer.
How cold does Division No. 8, Subdivision L get in winter?
Winter bottoms out in February, with lows near −8.7°C.
How much rain and snow does Division No. 8, Subdivision L get?
Some 1,247 mm falls in a year. Most of it comes in December (121 mm), the least in June (89 mm).
Are these figures for Division No. 8, Subdivision L itself?
They are the closest available: the normals for Twillingate, since Division No. 8, Subdivision L has none.
Data Source: Environment and Climate Change Canada · ECCC Data Services End-use Licence Today’s forecast for Division No. 8, Subdivision L →
Adapted from Statistics Canada (Census of Population 2021, population estimates 2025, 2021 census boundaries) under the Statistics Canada Open Licence; this does not constitute an endorsement by Statistics Canada. Neighbourhood names in some cities © OpenStreetMap contributors (ODbL).