Skyview RanchCalgary
Some 14,061 people live in this neighbourhood, in Calgary. Calgary is split into 152 neighbourhoods, and this is one.
Is Skyview Ranch a good place to live?
People here tend to be in good health (A). The trade-off is cost of living (D). Overall, that makes a B, better than 58% of Canadian towns. In the ranking it comes #222 of 473 in Alberta. The rest of its grades are middling: B− for safety, B for schools and C+ for jobs & income.
Rents here are the metro area's average, shared by every town and neighbourhood in it. Safety less sure: this is the whole city's figure, because the city doesn't publish open neighbourhood crime rates. Health is graded on the health region's survey figures and life expectancy, with the distance to hospital giving the town its own spread.
How Skyview Ranch grades
Each subject compares Skyview Ranch with Canadian towns of 2,500 or more, ordered by how far it is from the middle. Towns in other countries are graded separately.
How TownRatings grades Canadian towns →
What makes Skyview Ranch stand out
The 3 things Skyview Ranch does most differently from other towns.
The data
Data highlights are ordered by what stands out in Skyview Ranch.
Skyview Ranch earns an A for health
The town’s own part is the trip to care, and Skyview Ranch’s is long: 9.3 km to a hospital on average, against 3.7 km typical. Smoking takes in 7.9% of adults, age-standardised, lower than both Alberta’s towns (12%) and Canadian towns (12%). The survey puts the region’s share in very good or excellent health at 56%, ahead of the 53% for Alberta. People in the region live to 83.0 on average: 85.0 for women and 80.9 for men in 2022/2024.
Very good or excellent health · adults, age-standardised
| Health | Skyview Ranch | Alberta | Canada |
|---|---|---|---|
| Very good or excellent health | 56% | 51% | 52% |
| Smokers | 7.9% | 12% | 12% |
| Chronic conditions (average share) | 16% | 18% | 17% |
| Life expectancy at birth | 83.0 | 81.2 | 81.5 |
Statistics Canada, Canadian Community Health Survey 2023/2024 and life expectancy 2022/2024; Open Database of Healthcare Facilities · Area behind the health survey and life expectancy figures: the Calgary Zone
Rent takes more of local pay in Skyview Ranch than in Alberta’s towns or Canadian towns: 25% of household income
Shelter took 30% or more of income for 31% of households, above Alberta’s towns (21%) and Canadian towns (18%) alike. The median home value was $420,000, close to both Alberta’s towns ($400,000) and Canadian towns ($406,000).
What homes were worth · The median owner’s estimate at the 2021 census
| Census 2021 | Skyview Ranch | Alberta | Canada |
|---|---|---|---|
| Households spending 30%+ on shelter | 31% | 21% | 18% |
| Rent as a share of income | 25% | 20% | 20% |
Statistics Canada, Census 2021; CMHC Rental Market Survey via Statistics Canada · The 2021 census asked owners what their home was worth; those values, and 2020 incomes, are what this compares. · Rent as a share of income and monthly rent for a two-bedroom: one figure for all of the Calgary metro area
Skyview Ranch’s hazards at a glance: a low wildfire record and 8.1% of area homes over the radon guideline
Area-wide: earthquake risk, counted over the city of Calgary
Seismic risk in Skyview Ranch sits near the middle: $0.023 of expected damage per $1,000 of buildings a year, the typical town $0.030. No one has filed a flood map for Skyview Ranch on the national inventory. Skyview Ranch doesn’t get its own radon tests figures; the ones here come from the Calgary Health Region.
Radon tests above the guideline · share of tested homes, 200 Bq/m³
| Hazards | Skyview Ranch | Alberta | Canada |
|---|---|---|---|
| Radon tests above the guideline | 8.1% | 7.5% | 6.6% |
| Earthquake loss per $1,000 of buildings a year | $0.023 | $0.013 | $0.030 |
NRCan seismic risk model and burned areas, Health Canada radon survey, the Flood Hazard Map Inventory
Skyview Ranch leans Catholic: 2 of its 5 schools, where in Alberta it is 18%
The 4 with results split, 1 in the upper two fifths in Alberta and 2 in the lower. Its elementary schools are big ones, 573 students on average, against 274 in Alberta. The 3 km around Skyview Ranch counts 2 elementary schools and 3 schools for every grade, 3,802 students between them.
| School | Level | Students | System |
|---|---|---|---|
| Saddle Ridge SchoolLargest elementary schoolElementary · Grades K–4 | Elementary · Grades K–4 | 654 | English public |
| Peter Lougheed School Bottom fifth in AlbertaLargest secondary schoolAll grades · Grades 5–9 | All grades · Grades 5–9 | 1,037 | English public |
Schools by system · Schools within 3 km
| Schools within 3 km | Skyview Ranch | Alberta | Canada |
|---|---|---|---|
| School boards | 2 | 3 | 3 |
Provincial school lists and results, 2025/26
Commuters in Skyview Ranch travel further than in Alberta’s towns or Canadian towns, 29 min on average
88% of commuters drove, in line with Alberta’s towns (88%) and Canadian towns (89%).
How working residents got to work · census 2021
| Census 2021 | Skyview Ranch | Alberta | Canada |
|---|---|---|---|
| Average trip | 29 min | 26 min | 26 min |
| Car or van | 88% | 88% | 89% |
Statistics Canada, Census 2021 (labour and commuting) · The 2021 census was taken in May 2021, during COVID-19 restrictions: more people than usual worked from home or were off work.
Precipitation in Skyview Ranch trails that of 82% of Canadian towns: 445 mm a year
The frost-free season runs from 21 May to 18 September, 119 days. A normal June brings 113 mm of precipitation, more than any other month. The warmest stretch brings July afternoons of 23.5°C, close to Alberta’s towns (23.5°C) and below Canadian towns (25.5°C). Snow peaks in March: 24 cm in a normal year.
Average high by season · ECCC normals, 1991–2020
| Normals, 1991–2020 | Skyview Ranch | Alberta | Canada |
|---|---|---|---|
| Precipitation a year | 445 mm | 431 mm | 883 mm |
| July afternoon high | 23.5°C | 23.5°C | 25.5°C |
| Days with frost a year | 193 | 193 | 159 |
Environment and Climate Change Canada, Canadian Climate Normals 1991–2020 (Calgary (Airport))
Visible minorities make up more of Skyview Ranch than of Alberta’s towns or Canadian towns: 81%
1.3% of residents have an Indigenous identity, lower than both Alberta’s towns (4.6%) and Canadian towns (2.8%).
Ages · Share of residents in each age group, Census 2021
Schooling · Highest qualification, residents 15 and over
Women and men · all residents
Women make up 50.5% of Skyview Ranch
By the 2021 count the town had 7,095 women and 6,960 men, while Canada has 50.9% women.
| Skyview Ranch | Alberta | Canada | |
|---|---|---|---|
| Under 15 | 23% | 18% | 16% |
| 15 to 64 | 71% | 67% | 64% |
| 65+ | 5.8% | 15% | 19% |
| No certificate, diploma or degree | 14% | 15% | 16% |
| Postsecondary qualification | 60% | 54% | 56% |
Statistics Canada, Census 2021; Alberta and Canada: medians of towns of 2,500+
A normal November in Skyview Ranch runs from −8°C to 4°C
Snowfall in a normal November: 19 cm. Next comes December, with normal highs of freezing and lows of −12°C. Precipitation in November averages 16 mm. The forecast on the Weather page is ECCC’s for Calgary.
Normal highs, the months ahead · ECCC normals, 1991–2020
| Season | High | Low | Rain and snow |
|---|---|---|---|
| Winter | −1°C | −12°C | 34 mm |
| Spring | 10°C | −2°C | 108 mm |
| Summer | 22°C | 9°C | 232 mm |
| Autumn | 11°C | −1°C | 71 mm |
ECCC normals, 1991–2020 (Calgary (Airport)); the forecast is on the Weather page
Skyview Ranch sends Amanpreet Gill (Conservative Party of Canada) to the Commons from Calgary Skyview
Skyview Ranch’s riding for the Legislative Assembly of Alberta can’t be shown, because the province’s boundary file is licensed for non-commercial use only.
Wikidata, MAMH, MMAH, Statistics Canada
Each person Calgary Library serves borrows 12.7 items, more than at 82% of Alberta’s town libraries
Calgary Library serves the whole of Calgary, so the library figures on this page are the city’s: 1,285,711 people, Skyview Ranch among them.
Provincial library statistics, OpenStreetMap, the CRA and Statistics Canada
Skyview Ranch earns a B− for safety
The index for the force that serves it came to 67, below Alberta’s towns (110) and close to Canadian towns (67). Violent crime in the area its police cover: 10.6 per 1,000 people a year. Its police area records 31.9 property incidents per 1,000 residents a year. Behind Crime Severity Index, Violent Crime Severity Index, violent crime and property crime per 1,000 sits data gathered across the Calgary service area, with Skyview Ranch one part of it.
Year by year · Crime Severity Index for each year
| 2023–2025 | Skyview Ranch | Alberta | Canada |
|---|---|---|---|
| Crime Severity Index | 67 | 110 | 67 |
| Violent Crime Severity Index | 79 | 109 | 86 |
| Property crime per 1,000 | 31.9 | 45 | 31.2 |
| Violent crime | 10.6 | 14.2 | 12 |
Statistics Canada, Uniform Crime Reporting Survey, 2023–2025 average
Glenbow Ranch Provincial Park, 23 km away, is the closest provincial park to Skyview Ranch
A drive of 84 km reaches Banff National Park, the nearest national park.
Protected land · of the land within 10 km
| Outdoors | Skyview Ranch | Alberta | Canada |
|---|---|---|---|
| Protected land within 10 km | 0% | 0.4% | 2.3% |
| Public protected areas within 10 km | 0 | 2 | 4 |
Canadian Protected and Conserved Areas Database (CPCAD), OpenStreetMap routes and beaches
Everything we know about Skyview Ranch
Glenbow Museum and 11 more within 40 km
Nothing to visit is mapped within 5 km of Skyview Ranch; these are the best known within 40 km.
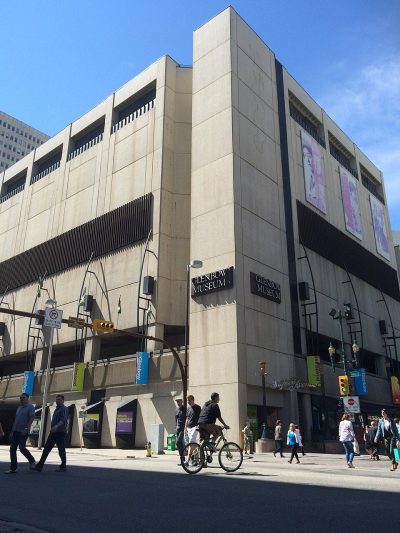 MuseumGlenbow Museum14 km southwest · 149K visitors a year (2019)
 AttractionCalgary Tower14 km southwest
 ZooCalgary Zoo13 km southwest
 MuseumTelus Spark Science Centre12 km southwest · 380K visitors a year
 CathedralSt. Mary's Cathedral15 km southwest
 GardenPrince's Island Park14 km southwest
Photos: each place’s Wikidata image, from Wikimedia Commons under the licence below (our copy, resized).
Photo credits (6)
- Glenbow Museum: Darthrussel, CC BY-SA 4.0, Wikimedia Commons
- Calgary Tower: Qyd, CC BY 2.5, Wikimedia Commons
- Calgary Zoo: Qyd, CC BY 2.5, Wikimedia Commons
- Telus Spark Science Centre: CharlesAPhillips63, CC BY-SA 4.0, Wikimedia Commons
- St. Mary's Cathedral: Dr Haggis at en.wikipedia, CC BY-SA 3.0, Wikimedia Commons
- Prince's Island Park: Scott5114, Public domain, Wikimedia Commons
About Skyview Ranch
Neighbourhood in Calgary
Skyview Ranch is a neighbourhood of Calgary, built by TownRatings from Statistics Canada’s smallest census areas and named from the city’s map or OpenStreetMap.
Statistics Canada: population estimates 2025 (17-10-0155), Census of Population 2021, 2021 census boundaries.
- Population
- 14,061 (people, 2021 estimate)
- Province or territory
- Alberta
- City
- Calgary
- Census subdivision
- 4806016
Skyview Ranch’s neighbours
The nearest places of 1,000 or more. Statistics Canada
| Town | People | km | Overall | Cost | Safety | Health |
|---|---|---|---|---|---|---|
| Skyview Ranch | 14,061 | — | B | D | B− | A |
| Redstone | 13,230 | 1.3 | B | C− | B− | A |
| Cityscape | 11,782 | 1.6 | C+ | D | B− | A |
| Saddle Ridge | 21,479 | 3.4 | C+ | C− | B− | A |
| Martindale | 14,467 | 4.6 | B− | C | B− | A |
| Taradale | 17,911 | 4.8 | C+ | C− | B− | A |
| Castleridge | 6,127 | 5.9 | C+ | C− | B− | A+ |
People: Statistics Canada, Census 2021. Distances: centre to centre.
Questions about Skyview Ranch
Is Skyview Ranch a young town or an old one?
At 32.1, its median age compares with 45.2 across Canadian towns. Children make up 23% of the population and seniors 6%.
Sources: Statistics Canada, Census of Population 2021 · population estimates 2025 (17-10-0155) and 2021 census boundaries · Uniform Crime Reporting Survey 2023–25 (35-10-0026, 35-10-0183 to 35-10-0190) · CMHC rents as published by Statistics Canada (34-10-0133) · grades by TownRatings. Under the Statistics Canada Open Licence.
Adapted from Statistics Canada (Census of Population 2021, population estimates 2025, 2021 census boundaries) under the Statistics Canada Open Licence; this does not constitute an endorsement by Statistics Canada. Neighbourhood names in some cities © OpenStreetMap contributors (ODbL).