
Circuit City, Sand City CA, 2009
Sand City’s story
56 years in pictures
Census counts: 212 in 1970, 325 in 2020. The archive holds 8 old photos and papers going back to 2007 and 4 maps from 1913 on.
- 1970Sand City is settled
Each edition grades its towns against each other only.

36% of residents live below the poverty line in Sand City, against 10% in California’s towns and 9.6% across U.S. towns. Sand City’s trail density is 0.1 miles per square mile, below both California’s towns (1.0) and U.S. towns (0.4). The biggest park or preserve is Monterey Bay National Marine Sanctuary, at 1,522 acres. Sand City has fewer than 1,000 residents, too few for fair grades; the figures below are still real.
Where Sand City beats most towns.
In a town this size, neighbors are the best guide. Ask them anything.
Census counts: 212 in 1970, 325 in 2020. The archive holds 8 old photos and papers going back to 2007 and 4 maps from 1913 on.
Who provides power, water and the rest in Sand City, and how to reach them.
EPA SDWIS (Oct 9, 2026) · HIFLD + EIA-861 2025 · Census 2020 ZCTAs · NCES 2024–25 · registration: vote.gov, updated Nov 18, 2024.
Ordered by what stands out in Sand City.
Most working residents leave Sand City for work: only 3% work in town. The average trip to work in Sand City is 21 minutes. Since 2013, Sand City has added 107 jobs, to 1,342 in 2023.
| Sand City | California towns | U.S. towns | |
|---|---|---|---|
| Average trip to work | 21 minutes | 28 minutes | 25 minutes |
| Working residents who work in town | 2.9% | 6.6% | 8% |
| Median household income | $78,000 | $95,000 | $80,000 |
Census LEHD 2023 · ACS
Expected storm and flood damage is higher than in 82% of U.S. communities.
FEMA National Risk Index · OpenFEMA
Sand City’s July high is 65°F. Sand City has warm winters and cool summers, with very little rain.
NOAA U.S. Climate Normals, 1991–2020
198 crimes were reported in Sand City in 2025: 184 property and 14 violent. In a town this small, a few incidents move the numbers a lot, so rates aren't shown.
Sand City is small, so we show counts rather than rates.
FBI crime data, 2025 · crimes reported to police
Sand City beats the California average on 0 of 32 CDC measures and trails it on 22. 29% of Sand City adults say their health is fair or poor.
| Sand City | California towns | U.S. towns | |
|---|---|---|---|
| Fair or poor health (CDC PLACES) | 29% | 22% | 19% |
| Frequent physical distress (CDC PLACES) | 18% | 14% | 14% |
| Food insecurity (CDC PLACES) | 26% | 16% | 14% |
| Smoke cigarettes (CDC PLACES) | 18% | 11% | 14% |
| What stands out | Sand City | CA |
|---|---|---|
| More adults with COPD | 8.7% | 5.1% |
| More adults facing a utility shut-off | 12.2% | 7.3% |
| More smokers | 18% | 10.9% |
CDC PLACES 2025 · modeled estimates for adults · CMS · HRSA
People 65 and older are 12% of residents (16% statewide). 36% of adults 25 and older have a bachelor’s degree or more, vs 37% across California. 29% never finished high school.
Somewhere between 16% and 52% women
The Census survey reached too few of Sand City’s residents to say more: its margin here is ±17.8 points. Across California, 50.1% of residents are women.
| Sand City | CA | U.S. | |
|---|---|---|---|
| Under 10 | 16.6% | 11.4% | 11.6% |
| 10 to 17 | 9.2% | 10.5% | 10.3% |
| 18 to 24 | 10.9% | 9.1% | 9.1% |
| 25 to 34 | 10.9% | 14.8% | 13.7% |
| 35 to 44 | 17.8% | 13.9% | 13.2% |
| 45 to 54 | 11.9% | 12.5% | 12.2% |
| 55 to 64 | 11.1% | 12.1% | 12.7% |
| 65 to 74 | 9.2% | 9.2% | 10.2% |
| 75 and older | 2.5% | 6.5% | 7% |
| No diploma | 29.3% | 15.3% | 10.4% |
| High school | 10.2% | 20.5% | 26% |
| Some college | 15.2% | 19.3% | 19.1% |
| Associate’s | 9% | 7.9% | 8.8% |
| Bachelor’s | 19.9% | 22.7% | 21.6% |
| Graduate | 16.4% | 14.4% | 14.1% |
U.S. Census Bureau · ACS 2020-2024 5-year estimates · in a town of 300, single groups can be off by several points
| Biggest places to walk | Trails | Acres |
|---|---|---|
| 1. Monterey Bay National Marine Sanctuary | — | 1,522 |
| 2. Fort Ord Dunes State Park | — | 3 |
| 3. Calabrese Park | 0.1 mi | 1 |
Trails & parks © OpenStreetMap contributors · Conserved land: USGS PAD-US
Museums, parks, gardens and other places to visit around Sand City. Close and well known come first.
 3 mi Zoo & aquariumMonterey Bay Aquarium
 3 mi MuseumMonterey Museum of Art
 7 mi Scenic drive17-Mile Drive
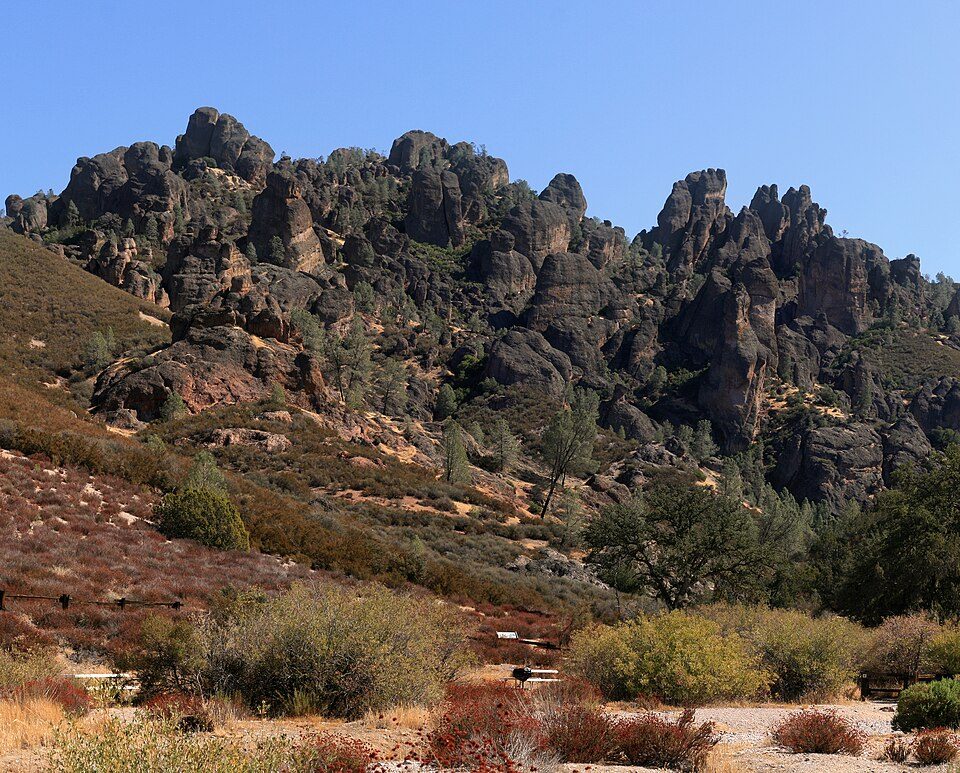 34 mi National ParkPinnacles National Park343K visitors a year11 mi Canyon & gorgeMonterey Canyon
 26 mi Theme parkSanta Cruz Beach Boardwalk
Monterey Bay Aquarium: Meij.kobayashi, Public domain · Monterey Museum of Art: Sgerbic, CC BY-SA 4.0 · 17-Mile Drive: Humanoid one, CC BY-SA 3.0 · Pinnacles National Park: Brocken Inaglory, CC BY-SA 3.0 · Santa Cruz Beach Boardwalk: Josta Photo, CC BY 2.0
5 within 15 miles of the center of Sand City
About 8 of every 100 Sand City residents are enrolled in college, about the same as California.
Where Sand City’s working residents go each day. Line width shows the share.
Census LEHD 2023
City in California, United States
Sand City is a city in Monterey County, California, United States, located on the shores of Monterey Bay, and surrounded on most sides by the larger city of Seaside. Sand City is located 2 miles (3 km) northeast of Monterey, at an elevation of 72 feet (22 m). The population was 325 at the 2020 census. The city is predominantly a business community, and has a number of larger retail stores. The West End area of Sand City, once an industrial area, hosts a growing artists' colony. Every August, the artists of Sand City and neighboring areas hold a street fair called the "West End Celebration".
From Wikipedia, licensed CC BY-SA 4.0 · facts via Wikidata (CC0)
Short answers, built from the data on this page.
Sand City has fewer than 1,000 residents, too few for fair grades; the figures below are still real.


