D−
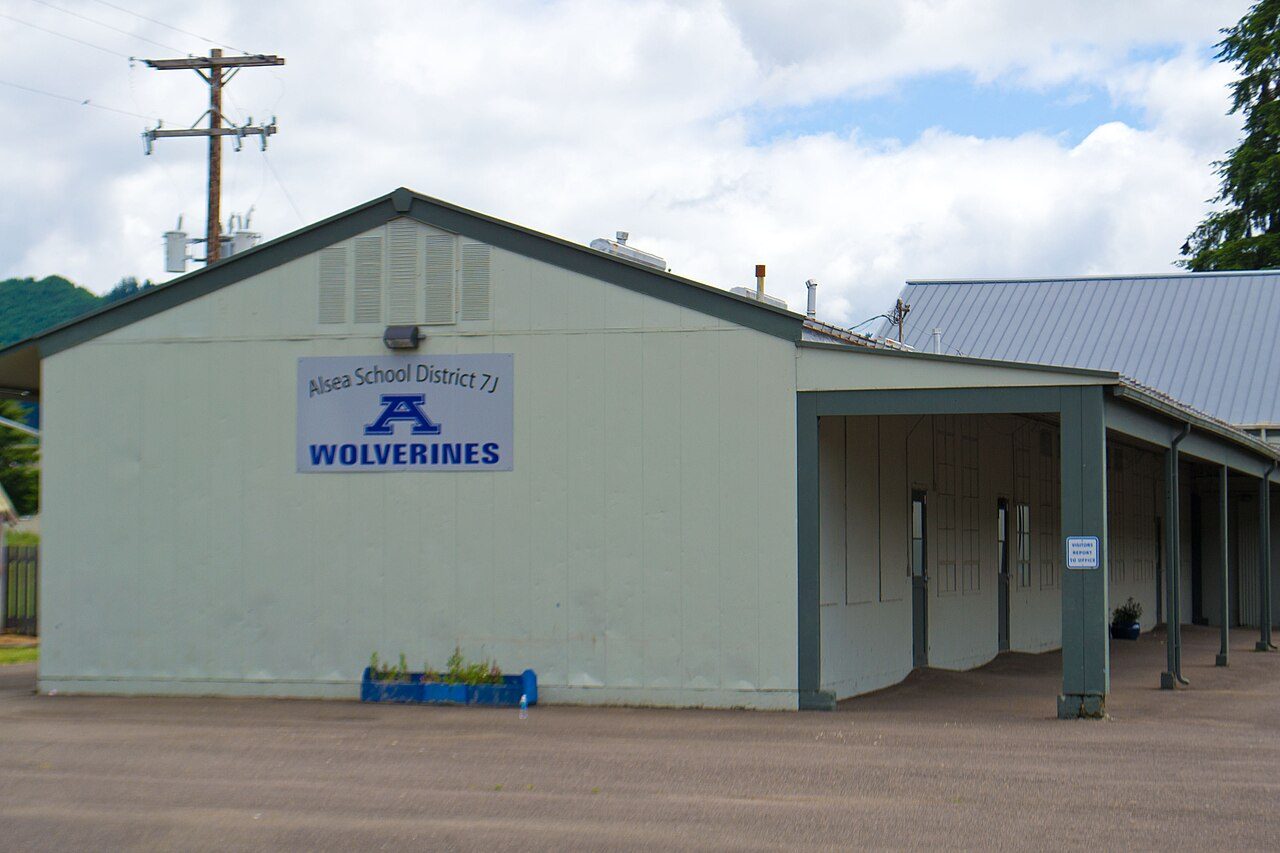
Photo: Visitor7 · CC BY-SA 3.0 · Wikimedia CommonsStudents
235
Students per teacher
24:1
Free or reduced lunch
68%
Setting
Rural
Grades
K–12
What stands out about Alsea Charter School
- Its own letter, D−: reading and math results near the bottom of Oregon’s public schools
- Math proficiency 21 pts below the state
- Reading / language arts 37 pts below the state
- Larger classes: 24 students per teacher
- Enrollment down 48.9% since 2020–21
Test scores
2020–21Math proficiency10%
State average 30.9%
Reading / language arts10%
State average 47%
Its own letter, D−, places these results among Oregon’s 753 public schools with results. Source: EDFacts via Urban Institute Education Data Portal (SY2020-21).
Location
Directions ↗


301 S Third, Alsea
Students
Enrollment by grade
Kindergarten14
Grade 113
Grade 233
Grade 331
Grade 423
Grade 526
Grade 617
Grade 717
Grade 815
Grade 911
Grade 1015
Grade 119
Grade 1211
Enrollment over time
460’20
941’21
509’22
281’23
235’24
Down 48.9% since 2020–21.
Who goes here
White 75%Hispanic 14%Two or more races 9%American Indian/Alaska Native 1%Black <1%Asian <1%Native Hawaiian/Pacific Islander <1%
As reported to NCES, share of students with a reported race or ethnicity.
Parents talk
Questions and answers about Alsea Charter School from Alsea families.
School facts: U.S. Department of Education (NCES), 2024–2025 school year. Test scores: EDFacts via Urban Institute Education Data Portal (SY2020-21). A school’s letter is our own summary of its reading and math results against Oregon’s other public schools; Alsea’s School Grade is built from its districts’ results. Map: © OpenStreetMap contributors.