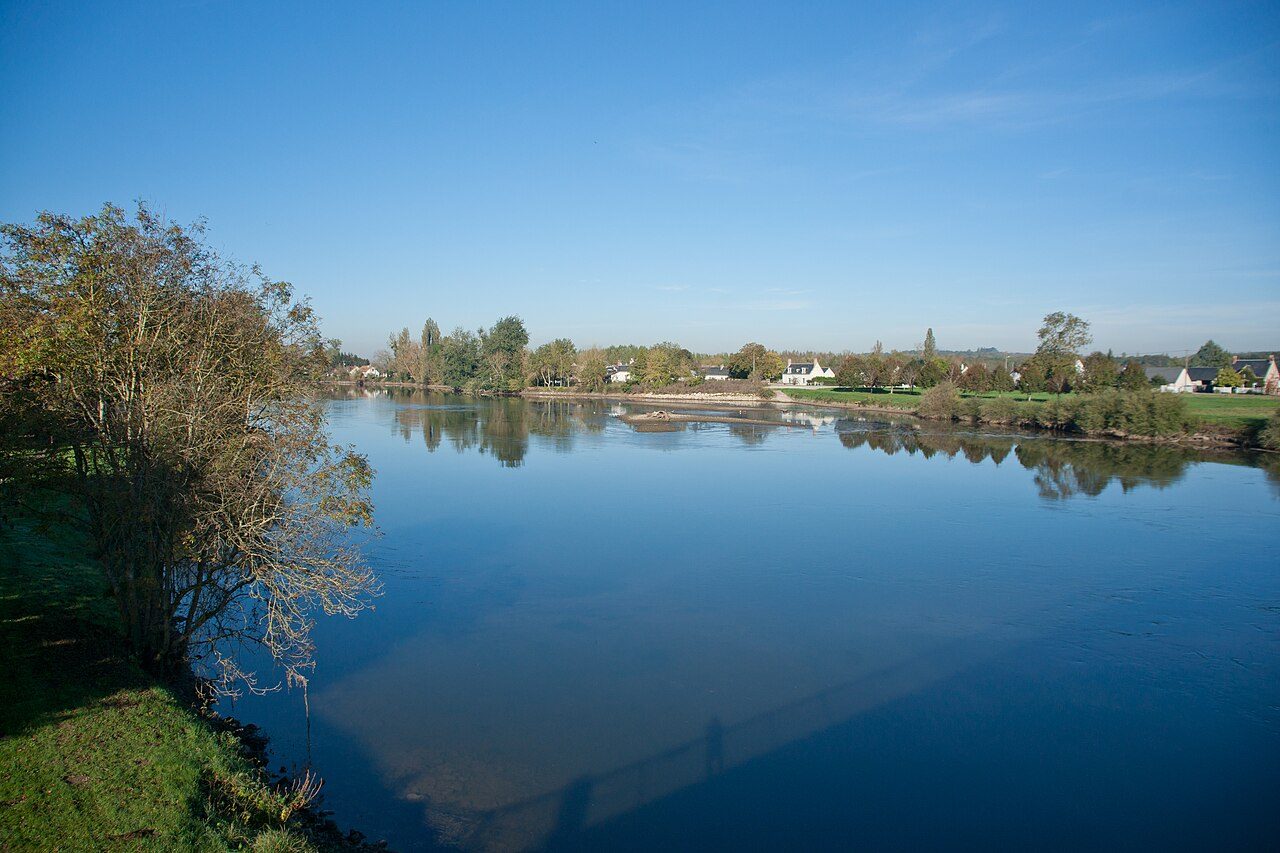
 Azay-sur-Cher · Ludovic Péron · CC BY-SA 3.0
How Indre-et-Loire stacks up
Indre-et-Loire ranks 21st of 97 French départements overall, ahead of most: best on health, weakest on cost of living.
Each subject puts an official figure for the whole département beside a measure built from our town grades. How this works
Safety
62nd of 100C+38/100 Behind most départements for safety. The département’s own figure and its towns both sit on the weaker side.
All eight crimes the town grades count (violence, burglary, vehicle crime, damage): 24.9 per 1,000 a year (France 25.2), 70th of 100.
Source: SSMSI, crime recorded by police and gendarmerie by commune, 2023 to 2025; where a commune’s count is hidden (five or fewer cases), SSMSI’s average for the département’s hidden communes, which adds up to the département’s own total; INSEE populations.
Measure: our Safety grade: recorded crime against residents (violence, burglary, vehicle crime, damage) per resident. The top quarter is the best-placed towns holding a quarter of the people in France’s 3,862 graded towns of 2,500 or more. 37 towns in Indre-et-Loire. Covers 94% of the residents of its graded towns.
Schools
30th of 100B+71/100 Better than most départements for schools. Its towns do better than the département as a whole: the figure for everywhere else pulls it down.
Value added at the brevet (results against what the pupils’ backgrounds predict): −1.6 points (France −1.0), 59th of 100.
Source: DEPP, 2025 brevet results and value added (IVAC) for every collège in the département with published results, weighted by candidates.
Measure: our Schools grade: brevet and bac results and value added of the collèges and lycées within 5 km. The top quarter is the best-placed towns holding a quarter of the people in France’s 3,926 graded towns of 2,500 or more. 40 towns in Indre-et-Loire. Covers 95% of the residents of its graded towns.
Cost of living
64th of 97C34/100 Behind most départements for cost of living. The département’s own figure and its towns both sit on the weaker side.
A year’s rent for a 70 m² flat: 38% of median income (France 45%), 51st of 97.
Typical price: €2,560 per m², the median of its communes’ sale prices (France €2,740), 64th of 97.
Typical advertised rent for a flat: €11.7 per m² a month (France €14.1).
Source: DVF sales July 2023 to June 2026, houses and flats; ANIL/DHUP rent map 2025 (predicted advertised rents, charges included); INSEE Filosofi 2023 incomes. The département’s price is the median of its communes’ median prices, weighted by sales, and its income the average of its communes’ medians, weighted by residents: INSEE’s and DVF’s own département figures aren’t loaded yet.
Measure: our Cost of living grade: prices and rents against the area’s income. The top quarter is the best-placed towns holding a quarter of the people in France’s 4,406 graded towns of 2,500 or more. 47 towns in Indre-et-Loire.
Health
11th of 100A90/100 Among France’s best départements for health. The département’s own figure and its towns tell the same story.
Deaths 2016–2025 against those France’s rates for each age give: 0.92 (France 1.00), 11th of 100.
Source: INSEE life expectancy by département, 2025; INSEE deaths by commune of residence 2016 to 2025, against France’s rates by age and sex.
Measure: our Health grade: the 10-year death ratio, adjusted for care-home places. The top quarter is the best-placed towns holding a quarter of the people in France’s 4,476 graded towns of 2,500 or more. 47 towns in Indre-et-Loire.
Jobs & income
26th of 100A−75/100 Better than most départements for jobs and income. The département’s own figure and its towns tell the same story.
Unemployment (census, ages 15–64): 10.5% (France 11.4%), 40th of 100.
Source: INSEE Filosofi 2023 (median disposable income per consumption unit; the département’s figure is the average of its communes’ medians, weighted by residents); INSEE census 2023 (unemployment, ages 15 to 64).
Measure: our Jobs & income grade: income, unemployment and jobs per working resident. The top quarter is the best-placed towns holding a quarter of the people in France’s 4,476 graded towns of 2,500 or more. 47 towns in Indre-et-Loire.
Getting about
14th of 100A87/100 Among France’s best départements for getting about. The département’s own figure and its towns tell the same story.
Drive to work: 78% (France 72%).
Source: INSEE census 2023, main way of getting to work; people who don’t travel to work left out.
Measure: our Walkability grade: everyday places within 800 m of residents, and walking, cycling and public transport to work. The top quarter is the best-placed towns holding a quarter of the people in France’s 4,433 graded towns of 2,500 or more. 47 towns in Indre-et-Loire.
Flood risk
Not gradedShown, not graded. France has no national map of flood zones yet (flood maps cover designated areas only), so flood risk isn’t graded for towns or départements. These figures show the record instead.
Communes with a flood or coastal-flood risk plan in force: 39% (France as a whole 34%).
Source: Géorisques: CatNat natural-disaster declarations (GASPAR) and natural-risk prevention plans (PPRN), every commune.
Towns aren’t graded on flood risk either. Each town’s Flood & hazards page lists its disaster declarations, risk plans, clay, seismic zone and radon.
Growth
37th of 100B64/100 Better than most départements for growth. The département’s own figure and its towns tell the same story.
Since 2017: +2.1% (France +2.4%), 44th of 100.
Source: INSEE census populations, 2012, 2017 and 2023.
Measure: population change from 2012 to 2023 (INSEE census). The top quarter is the best-placed towns holding a quarter of the people in France’s 4,476 graded towns of 2,500 or more. 47 towns in Indre-et-Loire.
How Indre-et-Loire compares with its neighbours
| Indre-et-Loire | Indre | Loir-et-Cher | Maine-et-Loire | Sarthe | |
|---|---|---|---|---|---|
| Overall | A− 7921st of 97 | C 2771st of 97 | B− 4554th of 97 | A+ 992nd of 97 | B− 5346th of 97 |
| Safety | C+ 3860th official · 27% in top towns | B− 4540th official · 21% in top towns | C 3454th official · 17% in top towns | A− 8234th official · 51% in top towns | C 2886th official · 24% in top towns |
| Schools | B+ 7140th official · 70% in top towns | C− 2387th official · 15% in top towns | D 993rd official · 10% in top towns | A− 7819th official · 37% in top towns | B− 5339th official · 13% in top towns |
| Cost of living | C 3462nd official · 21% in top towns | A+ 982nd official · 100% in top towns | A− 8125th official · 100% in top towns | B 5646th official · 60% in top towns | B 6037th official · 56% in top towns |
| Health | A 9018th official · 43% in top towns | C− 2198th official · 7% in top towns | B+ 7241st official · 25% in top towns | A+ 9617th official · 76% in top towns | B+ 7037th official · 18% in top towns |
| Jobs & income | A− 7532nd official · 30% in top towns | C 3481st official · 9% in top towns | B+ 6651st official · 20% in top towns | A− 8342nd official · 32% in top towns | B 5653rd official · 18% in top towns |
| Getting about | A 8721st official · 32% in top towns | C 2674th official · 0% in top towns | C+ 3764th official · 0% in top towns | B+ 7438th official · 22% in top towns | B 6037th official · 0% in top towns |
| Flood risk | Not graded | Not graded | Not graded | Not graded | Not graded |
| Growth | B 6443rd official · 16% in top towns | D 694th official · 0% in top towns | C− 1879th official · 2% in top towns | B 6235th official · 11% in top towns | C 2969th official · 3% in top towns |
Each cell: the subject’s grade and score, the département’s rank on the official figure (1st = the better end), and the share of its town residents living in a top-quarter town for France. Neighbour names open their report cards.
How this report card works
Two measures, side by side. The left card is an official figure for the whole département, its towns, villages and countryside together, added up from every one of its communes and ranked against France’s other départements. The right card is built from our town grades: of everyone living in the département’s graded towns of 2,500 or more, the share whose town is in the top quarter for France. Quarters are of people, not towns, so a département of big cities isn’t marked down just for being urban. A département can do well on one measure and not the other; that difference is often the story.
Scores and grades. Each subject’s score (0–100) is the département’s standing among France’s 100 départements, overseas included: the two measures’ percentiles are averaged, then ranked again, the same method as our town grades. 100 is the best département, 0 the last. Letters use the town-grade scale (A+ from 95, A from 85, A− from 75 … D below 15). The overall score weighs safety 18, cost of living 18, schools 16, health 14, jobs and income 12, getting about 8, growth 8 (out of 100), over the subjects a département has, and needs a Safety grade. Départements with fewer than 5 graded towns are graded on the official figures alone.
What it is not. A département figure averages everyone, so it can’t show whether a département is evenly good or a mix of very good and struggling places. The town measure shows the mix but leaves out villages and towns under 2,500. Neither says anything about any one street.
Gaps. Flood risk isn’t graded: France has no national flood map yet. Guadeloupe, Martinique and French Guiana have no income figures, so no Cost grade and no overall grade. Alsace and Moselle publish no sale prices, so their cost uses rents. Where a commune’s crime count is hidden, the département’s average for its hidden communes stands in: added up, these give the département’s own total. Sources are named under each figure. How grades work
Sources: TownRatings grades: our own summary of the data, ranking French towns against each other only, run #47 of October 30, 2026 · Département figures: every commune added up from SSMSI, INSEE, DEPP, DVF, ANIL and Géorisques data. Under the Licence Ouverte / Open Licence 2.0 (Etalab).
Contains public sector information under the Licence Ouverte / Open Licence 2.0 (Etalab): INSEE, DGFiP, the Interior Ministry’s statistics service (SSMSI), the Ministry of Education (DEPP), the Health Ministry’s statistics service (DREES) and the Housing Ministry (Carte des loyers). Commune boundaries: IGN Admin Express.